How to use 6 basic charts to create effective reports

Communicating your study’s results to your co-workers, managers, and clients in a way that is both professional and easy to understand is a crucial skill for any researcher.
Many studies with amazing results are not acted on or fall to the wayside because of its confusing report. In a report, charts go a long way in illustrating findings that are clear and concise.
The main challenge with using charts is selecting the correct type from the wide variety available. Many people do not understand the strengths and weaknesses that come with survey chart types, either deciding off the cuff which looks the nicest or staying in their comfort zone by overloading their report with pie or vertical bar charts. It is important for researchers to use the most effective chart to display their data results. This article will go over six basic charts and how to successfully implement them into your reports. Let’s get started!
Learn how to create custom charts and data tables from your survey results today!
1) Vertical bar charts
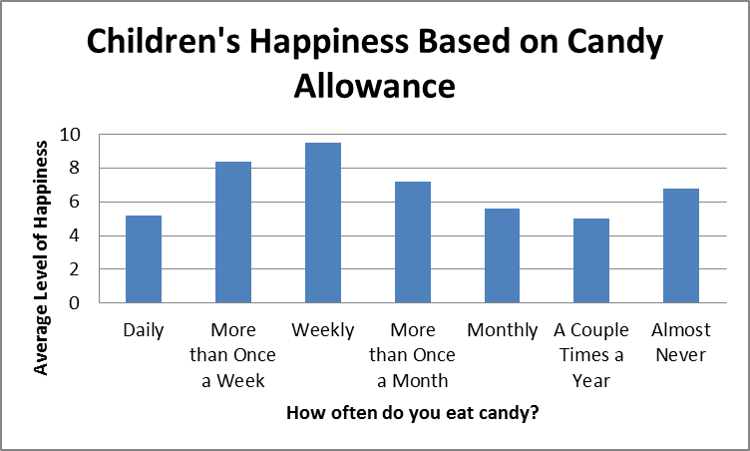
Vertical bar charts are best for comparing means or percentages between 2 to 7 different groups. As you can see, each bar is separated by blank space. For this reason, the x-axis should be based on a scale that has mutually exclusive categories (like multiple choice, or check box questions). Categories that are based on a continuous scale are better suited for a histogram, but we will look at those later. As for this chart, respondents were only able to select one distinct option (daily, weekly…) making its cross analysis with happiness perfect for a vertical bar chart.
2) Horizontal bar charts

The horizontal bar chart is used when comparing the mean or percentages of 8 or more different groups. As with the vertical bar chart, the horizontal bar chart should only be used when comparing categories that are mutually exclusive. In this chart, more than 7 categories of candy were measured independently and are being compared to one another.
3) Pie charts
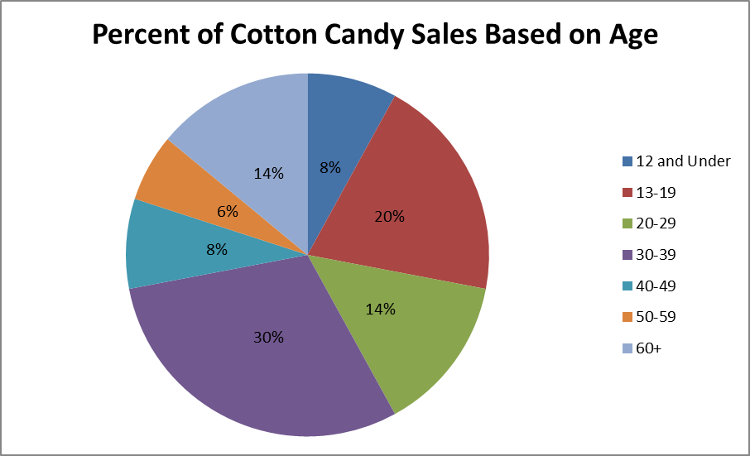
Pie charts are best used to illustrate a sample break down in a single dimension. In other words, it is best to use pie charts when you want to show differences within groups based on one variable. In the example above, we broke down the sample group into different age groups in order to show the significance of age on cotton candy sales. It is important to remember that pie charts should only be used with a group of categories that combine to make up a whole.
4) Line charts
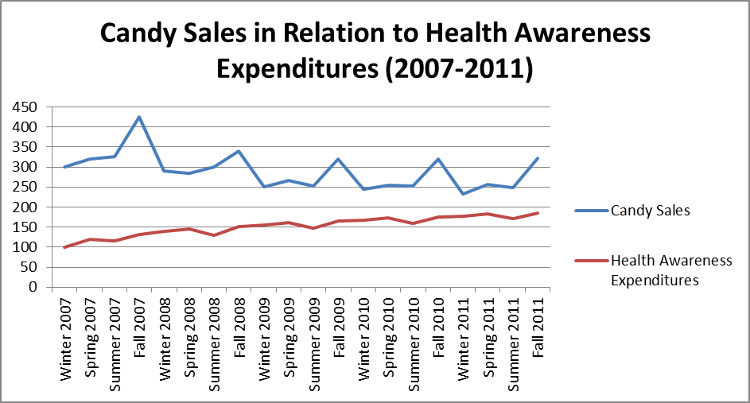
Line charts are used to illustrate trends over time. This is done most often to measure the long term progression of sales, or any other empirical statistic important to businesses or organizations. It can also be used to compare two different variables over time. In our example, we see how the increased government funding in healthy living correlates with candy sales over the span of 5 years.
5) Scatter plot

Scatter plots are used to depict how different objects settle around a mean based on 2 to 3 different dimensions. This allows for quick and easy comparisons between competing variables. In our example chart above we can see how each candy compares to one another based on its cost to make and selling price. As a viewer, one can quickly reference the difference between two objects or its relation to the average, which is shown as the large square on the chart.
6) Histogram
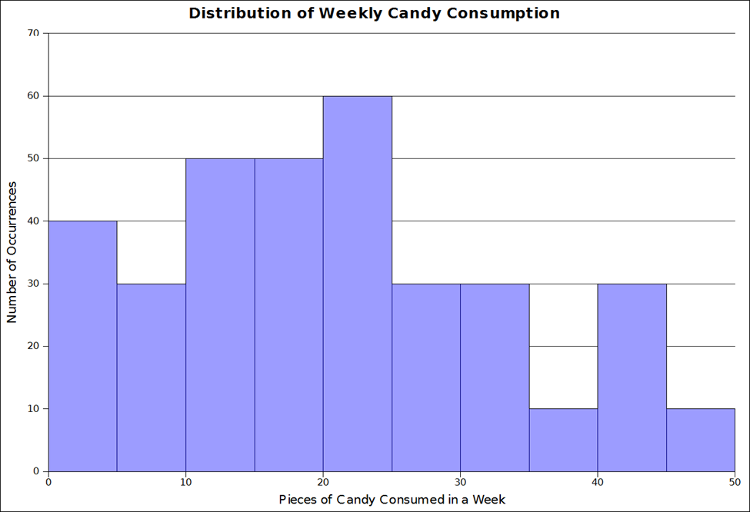
Like pie charts, histograms break down the sample distribution in one dimension. The real difference between histograms and other forms of charts is that histograms are ideal for illustrating sample distributions on dimensions measured with discrete intervals. Unlike horizontal and vertical bar charts, the x-axis is not divided into mutually exclusive categories. In our example, the histogram indicates how many respondents fall into each range of candy consumed per week. The x-axis is a continuous scale, while each bar falls under a range of five units, or pieces of candy, on that scale.
The power of charts
Learning to use these 6 chart types effectively will make your reports both professional and clear. Though there are much more complex forms of charts for displaying data results, the ones discussed in this article are the most common and universally known. More complex chart types will most likely result in confusing viewers rather than impressing them. This is why many argue that harnessing the full potential of these better known chart types is a much more useful endeavour. So go ahead, experiment with these charts and bring your reports to the next level of excellence!
Discover more resources

Toolkits directory
Discover our toolkits, designed to help you leverage feedback in your role or industry.

Unlocking ROI with Salesforce and SurveyMonkey
How to enrich your survey data with existing customer data in Salesforce to drive better CX and NPS, CSAT, and more.

Power your business with online order forms
Easily build and customize order forms and receive payments for your goods and services or use one of our expert-built templates to get started in minutes.

Five integrations to help you discover new insights
Integrate survey data into your most-used apps to get more insights from your feedback.