Cross tabulation analysis: definition and examples
One of the most frequently used tools for data analysis is cross-tabulation. Learn what it does and how to use it.

Cross-tabulation, also called contingency table analysis or crosstabs, analyzes categorical data by showing the relationship between two or more variables. It’s a go-to technique for making sense of survey results and uncovering actionable insights.
With over 25 million questions answered daily on the SurveyMonkey platform, our survey experts have a wealth of knowledge about survey analysis, including how to maximize the benefits of crosstab analysis.
Read on to learn what crosstab analysis is, how it works, and how you can use it to interpret your survey data more effectively.
What is cross tabulation?
Cross tabulation (crosstab) is a useful analysis tool commonly used to compare the results for one or more variables with the results of another variable. It is used with data on a nominal scale, where variables are named or labeled with no specific order.
Crosstabs are basically data tables that present the results from a full group of survey respondents as well as subgroups. They allow you to examine relationships within the data that might not be obvious when simply looking at total survey responses.
Benefits of cross tabulation
With cross tabulation, you can examine your data in a variety of ways to achieve a deeper understanding of groups within your respondents.
Reduce confusion when analyzing data
Analyzing large datasets can be difficult. Finding relevant, actionable insights within large amounts of data is even more complicated. Crosstabs simplify and divide data into subgroups for ease of interpretation—they show percentages and frequencies that may change when contrasted with variables in other categories. By making datasets more manageable at scale, fewer errors will result.
More granular data points
Using crosstabs, you can examine the relationships between one or more variables, which leads to insights on a more granular level. These insights could go unnoticed without crosstabs, lost in a sea of data, or require additional work to reveal. Use multiple filters to dig even deeper into data to uncover more details.
Actionable insights
Using crosstabs simplifies datasets so that you can make quick comparisons between them. This means faster insights for creating new marketing strategies guided by the data. You are also able to watch for global trends across survey responses and take action accordingly.
Clarity of interpretation
When you use crosstabs, datasets are simplified and divided into subgroups. The resulting clean data is in a more digestible format and easily viewed and used by research professionals and team members without analytics training.
When to use cross-tabulation
Cross tabulation is typically used when you have information that can be divided into mutually exclusive groups, also known as categorical variables. It allows you to examine relationships within the data that may not be readily apparent. A crosstab report can show the connection between two or more survey questions from the study in market research studies.
Who uses cross tabulation?
Crosstabs are used across multiple industries and job functions. Examples of departments that benefit from crosstab analysis include:
HR departments can use cross tabulation to examine employee survey data about company culture, managerial guidance, employee engagement, and more. Using crosstabs will assist HR with determining departments that have particular problems or needs that they can address.
Market research teams can take raw data and make it more digestible for management decision-making with crosstabs.
Customer support teams can use crosstabs to evaluate customer satisfaction levels between long-term and new customers.
School administration can use instructor evaluation data from students and cross-tabulate it with the class subject, time of class, and other data to help improve the educational experience for students.
Cross tabulation and Chi-square
A Chi-square test is used to test data in a cross-tabulation table to determine whether or not the data is statistically significant. The results are statistically significant if the two categorical variables are independent (unrelated). Basically, the Chi-square test is a correlation test for categorical variables.
Crosstab vocabulary
Here are some vocabulary words that can be used when it comes to crosstabs:
- Banners (Cuts): the headers at the top of each column that name the categories of the data
- Categories: how variables are grouped
- Chi-square test: analysis to determine the statistical significance of cross-tabulation by determining if the compared variables are independent. A measure of how actual data compares to expected data
- Columns: cells that display data vertically
- Column-percentage: view of data that calculates the column data belonging to a particular row
- Count (Frequency): total number of responses that fall into a row or column
- Crosstabs, cross tabulation or contingency table: table used to analyze categorical data
- CSV: comma-separated values files are used to export complex data from one application and import into another, such as a notes file or spreadsheet
- Filters: used to focus your crosstab on a particular view of the data
- Percentage: percentage of responses that fall into rows or columns
- Pivot table: If you use Excel, pivot tables can be used to create crosstabs
- Rows: cells displaying data horizontally
- Row-percentage: data view that calculates the row data that belongs to a particular column
- Statistically significant: determination that results of data are not explainable by chance
- Stubs: headers that name the categories of data displayed by rows
Crosstab examples
Example 1
Employee satisfaction: The following is a cross tabulation example from SurveyMonkey that was created with data from an employee satisfaction survey. The survey used multiple-choice questions to ask employees:
- How happy they are at work
- How long they intend to stay at their jobs
- How long they’ve been in the organization
- How many hours they work per day (on average)
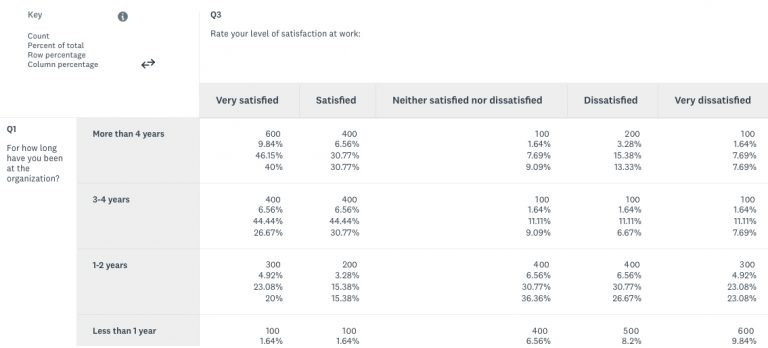
The questions that define the groups are in the columns, and the questions used to compare the groups are in rows. This is the typical format of a crosstab report.
From this crosstab table, you can see that there is a relationship between employees who have been at the company longer and their level of satisfaction. Once you’ve identified this relationship, you can explore it further to find out the root cause of this relationship. From the data you have, you can’t definitively say that one variable is impacting the other. In other words, the data identifies a correlation between longer-term employment and employee satisfaction, but it does not imply causation.
Tip: Be careful when analyzing your data to ensure that you don’t confuse correlation with causation.
Example 2:
Purchase Intent: In this example, you want to know which gender of survey respondents is more likely to purchase your product.
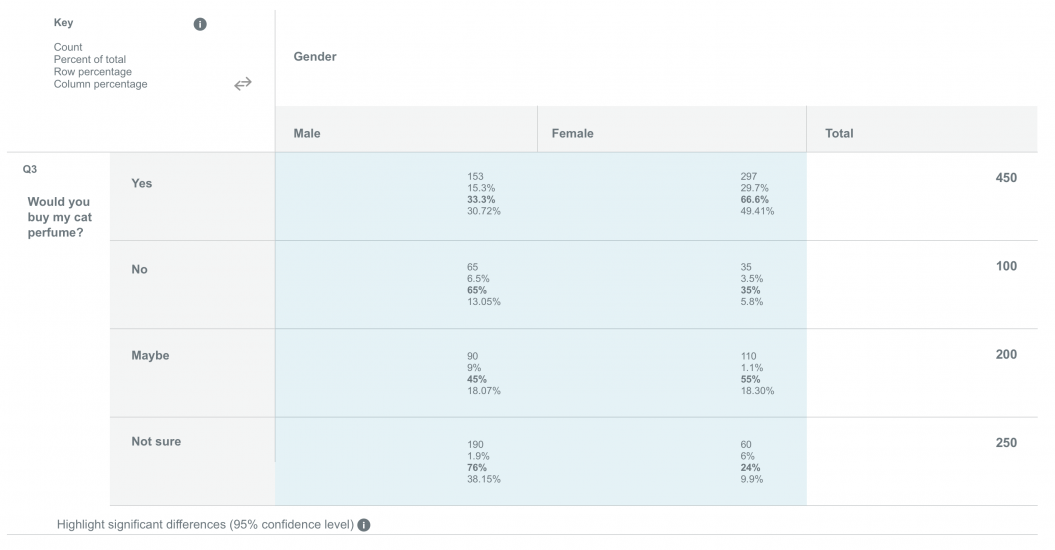
Again, the data that defines the groups appear in the columns (male and female). And the question for comparison is in the rows (would you buy my cat perfume?).
If you only considered overall results without using crosstabs, you’d find that 54% of survey respondents report that they would be interested in purchasing your product. You wouldn’t have a clear picture of the purchase intent by gender, which would undoubtedly play a part in personalizing your marketing efforts.
With cross tabulation, you find that 45% of all respondents say they will definitely purchase your product and that 66% of those respondents are female. You can use this information to guide everything from product naming to packaging to messaging.
Crosstab report insight examples
There are numerous insights to be uncovered with crosstabs. Here are just a few examples of questions that can be answered with crosstab reports.
How do customer satisfaction levels differ between new customers and customers who have purchased from you before?
What is the relationship between customer satisfaction level and whether they would recommend our product?
Would your most satisfied customers share their positive reviews on social media channels?
What do customers who are not satisfied with your product cite as their main complaint?
How do employees in different departments feel about our company?
Is there a relationship between office location and satisfaction?
Is there a difference between men and women with their intent to purchase my product?
Does age make a difference in our brand awareness?
How do students in certain programs of study feel about the availability of student resources?
Is there a relationship between a particular program of study and student satisfaction?
Crosstabs illuminate insights into your data
When you need to dig deeper and reveal data on a more granular level, crosstabs and filters are your best bet. Save time, reveal detailed insights, and get more from your data with SurveyMonkey and cross-tabular data. Visit our help section to find out how to create your own crosstab report.
See how SurveyMonkey can power your curiosity
Discover more resources

Solutions for your role
SurveyMonkey can help you do your job better. Discover how to make a bigger impact with winning strategies, products, experiences, and more.

What’s new at SurveyMonkey: The CuriosityCon 2026 product reveal
Discover the 5 major innovations unveiled at CuriosityCon 2026, from our Claude integration to automated market research and GetFeedback news.

The curiosity gap: Why the AI era demands better questions
AI can answer almost anything, but it can't ask the right questions. New research from SurveyMonkey's State of Curiosity Report reveals how to turn curiosity into your sharpest competitive advantage.

Launch winning brands and spot trends fast with market research solutions
Learn how our market research platform can help you collect quality data. Discover our online panel and purpose-built solutions.