Customer lifetime value (CLV): what it is and how to improve it

Great customers come back time and time again. Well, we hope they do.
Customer lifetime value (CLV) represents the total amount a customer will spend with your company. A high CLV suggests happy customers who keep returning for more. Your business can expect increased profit, boosted loyalty, and high satisfaction rates with regular customers.
Let’s outline what CLV is, how to calculate it, and explore strategies to increase your company’s customer lifetime value over time.
You’ll be retaining customers in no time.
What is customer lifetime value?
Customer lifetime value is the total net profit a repeat customer will generate for your company over their lifetime. As retaining an existing customer is much cheaper than acquiring a new one, increasing CLV can help to drastically increase profit.
Several factors impact customer lifetime value:
- Customer average purchase value: This metric describes the average amount of money a customer spends on each purchase.
- Purchase frequency: Purchase frequency represents the number of purchases over a set period.
- Customer satisfaction: Customers who report higher rates of satisfaction are more likely to show the above two factors to a greater extent.
Beyond just representing net profit, a high customer lifetime value reflects a sustainable and positive customer experience (CX). Building strong customer relationships and constantly refining your customer experience will help increase CLV.
With the customer experience at the center of CLV, monitoring happiness with customer satisfaction surveys is the key to success.
How to calculate customer lifetime value
For a metric as crucial as CLV, the formula to calculate it is relatively simple.
You’ll need the following data to calculate customer lifetime value. We recommend using a year as the period discussed here.
- Customer average purchase value: Calculate the average cost of a purchase by dividing the total amount customers have spent with your business by the number of purchases in a set period.
- Purchase frequency: In that same set period, divide the number of purchases by the number of customers who made a transaction.
- Customer value: Using the previous data, multiply the purchase frequency by the average value.
- Average lifespan: Determine the average amount of time that a customer continues to shop with your brand.
With these data points, you can work out the customer lifetime value by multiplying the customer value by the average lifespan.
We can also think of CLV as the product of the average transaction size x the total number of transactions x the length of the retention period.
For example, let’s calculate the CLV of a customer who buys a $50 product from your business twice a year and remains a customer for ten years.
$50 (average product price) x 2 (frequency per year) x 10 (years of being a customer) = CLV of $1000
How to leverage surveys to drive CLV
A satisfied customer is far more likely to make another purchase from your company than a dissatisfied customer is. To retain customers and improve CLV, then, be sure to collect and listen to feedback from satisfied, as well as dissatisfied, customers. Unfortunately, according to a Zendesk study, satisfied customers are about 50% less likely to give your company feedback.
Excellent customer experience management will help to improve customer satisfaction. Across the board, this can lead to:
- Positive word-of-mouth marketing
- Boosted customer loyalty
- Increased profits
- Lower customer churn
Surveys are a tool that can give you direct insight into what your customers want. By fixing problems they experience and refining your offering, you can align your business to please your customers.
Let’s explore how you can leverage surveys to drive CLV in your organization.
Related reading: 9 key metrics for measuring the customer experience.
Identify customer pain points
Every business has one area they could work on. For some, that could be improving the check-out process. For others, their website could be outdated. Each of these areas can create minor frustrations that make it harder for customers to achieve the outcome they want.
Identifying these customer pain points can allow your business to develop a strategy to fix them. One of the most effective ways to find pain points is using a Customer Effort Score (CES) survey. These surveys will outline areas in the customer journey where customers feel frustrated.

Collecting data on customer pain points gives you a clear map to follow to mitigate these problems and streamline the customer journey. A better customer experience will lead to improved retention and help to increase your CLV.
Here’s a CES Survey Template you can use to get started.
Drive product improvement
Your product is one of the most important aspects of running a business. A great product inspires your customers to return for more. You can survey your customers and gain product feedback to help improve your offering over time.
Product feedback surveys act as a tool to learn how your customers interact with your product. You’ll get information on what they like, what they dislike, and potential features you can integrate in the future.
While you can use specific product surveys, you could also launch Customer Satisfaction (CSAT) surveys. Launching a CSAT that asks for open-ended information, like:
- How satisfied is a customer with your service?
- What could the service improve upon?
These questions will yield data that you can use to pinpoint strengths and weaknesses in your product. You can improve your offerings over time by iterating on your product and services based on this customer feedback. A better product or service increases the likelihood of returning customers and a boosted CLV.
Improve customer satisfaction
A satisfied customer is far more likely to make another purchase from your company than a dissatisfied customer is. Collect and listen to feedback from satisfied and dissatisfied customers to retain customers and improve CLV.
To reach the silent majority of satisfied customers, take measures to improve your overall survey response rate. A high response rate produces more statistically significant results and data that a few angry customers don’t skew.
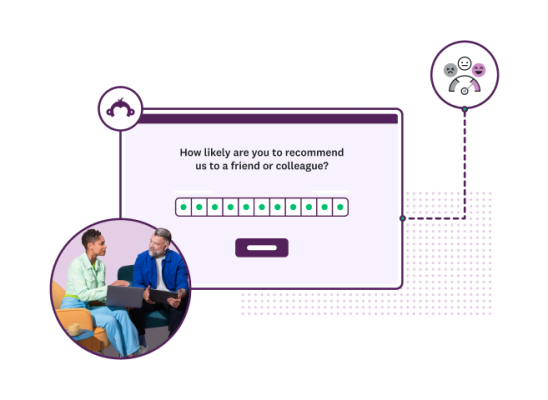
The Net Promoter® Score (NPS) Survey Template is always a good place to start your customer satisfaction survey. NPS uses how likely a survey respondent is to recommend a company, product, or service to measure customer satisfaction.

NPS is a popular way to measure customer satisfaction for several reasons:
- It’s short: It’s just one question. Since most people spend 10 minutes or less filling out a survey, they’re far more likely to complete a shorter survey. And the more likely people are to complete a survey, the more accurate its results are.
- The “likeliness to recommend” metric is versatile: It applies to any customer interaction with your company, whether purchasing a product, using a service, or interacting with customer service. It also applies to both new and repeat customers.
- NPS results are useful: NPS is a good indication of customer loyalty, which directly links to customer lifetime value. Repeat customers decide on “likeliness to recommend” based on all of their experiences, so you can track the overall sentiment of your most valuable customers. Follow up the NPS survey with more specific questions. Use an open-ended question to ask customers to explain their score or select one from our Question Bank.
Build customer loyalty programs
According to customer experience teams, the number one priority of CX programs is to increase customer retention (43%). In a close second place is boosting customer loyalty (41%). Customer loyalty is directly linked to CLV, as loyal customers will keep purchasing over time.
Enhancing your customer experience by incentivizing loyalty with programs will help to increase retention. Using customer loyalty surveys will help to reveal what rewards and incentives make customers stick around for longer. Are they looking for a discount? Or are they searching for a sense of community?
Your customers are your most insightful resource. You'll encourage repeat business by asking them questions and formulating loyalty programs around their response. Loyal customers are vital as they:
- Are willing to pay more
- Are easier to sell to
- Aid with word-of-mouth marketing
- Provide valuable feedback
Enhance customer support
Customer support helps your customers quickly solve any problems they encounter. An effective customer support team will improve this experience and answer any questions your customers may have.
You can understand how impactful your customer support team is using customer support surveys where you can gather quantitative and qualitative feedback.
You can enhance your customer support over time by breaking down this feedback into active improvement points. Better customer service performance can positively affect overall customer satisfaction and improve CLV.
Forecast future customer behavior
While current and past data are useful for improving your customer experience and CLV, the story doesn’t end there.
Businesses can use predictive analysis to forecast consumer behaviors from their survey data. This future-focused strategy will help your business to anticipate needs before they arise.
Instead of reacting to problems, this allows your business to become proactive. Proactively adapting to problems and streamlining your customer experience will help decrease the chance of future issues arising.
If your customers feel supported across their entire journey with your business, they’re more likely to extend the period they shop with you for as long as possible. While your customers will thank you for this, you’ll also see improvements to your CLV.
It’s a win-win.
Use surveys to improve your customer lifetime value
A high customer lifetime value reflects all the hard work you’ve put into building a positive customer experience. By collecting CX data from surveys and improving your customer touchpoints, you’ll help to enhance the customer experience and increase your CLV.
Over time, continual improvement will help deliver more value to your customers and, in turn, more value back to your business.
Get the insights you need to delight your customers with SurveyMonkey.
Discover more resources

Customer satisfaction survey templates
Explore our customer satisfaction survey templates to rapidly collect data, identify pain points, and improve your customer experience.

See why Together Labs relies on SurveyMonkey for user insights
Discover why Together Labs ditched Google Forms and upgraded to SurveyMonkey Enterprise to collect in-depth user feedback.

Learn how Point of Reference gets the most out of NPS surveys
Discover how Point of Reference uses SurveyMonkey to capture valuable customer feedback, including Net Promoter Score (NPS®).

Ecommerce Payment Form Template
Streamline your online transactions with our Ecommerce Payment Form Template. Secure, easy to use, and customizable to fit your business needs.
See how SurveyMonkey can power your curiosity
Net Promoter, Net Promoter Score, and NPS are trademarks of Satmetrix Systems, Inc., Bain & Company, Inc., and Fred Reichheld.