What are t-tests? A guide to analyzing survey results
Learn how to identify statistically significant differences in group means, survey results, and A/B test outcomes with a simple t-test.

While anyone can see the difference between two numbers, finding out whether that difference is statistically significant can take more work.
Let’s say you’ve run a customer satisfaction survey at work. Your boss wants to analyze if men give your company a lower Net Promoter Score℠ (NPS) than women.
In the data, you see that the average rating from male respondents was 9, compared to an average score of 12 from female respondents. How can you determine if nine is significantly different from 12? This is where t-tests come in.
In this article, we’ll define t-tests and their use cases, share examples of t-tests, and explain how to interpret your results.
What are t-tests?
A t-test is a statistical test that assesses whether the difference between two means is significant using the t-distribution. It helps you determine whether an observed gap between groups reflects a real difference or is likely due to chance.
Testing for statistical significance is common in concept testing and product testing. In concept testing, AB tests are commonly used to determine if one ad concept performs better than another. Similarly, product testing can determine if a product will hold its own when launched into the market.
T-test formulas
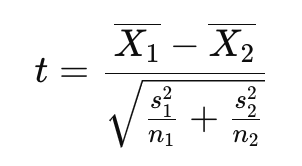
T-tests use specific formulas to compare means and determine whether a difference is statistically significant. The two-sample t-test is the most common in survey analysis:
Here are the formulas for the one-sample t-test and paired t-test:
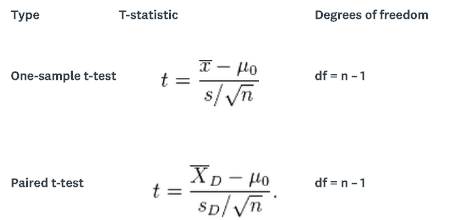
In both the one-sample and paired t-tests, the calculated t-value is compared to a critical value from the t-distribution to assess significance.
What is a t-test used for?
Use a t-test when you want to know whether two averages are meaningfully different, not just numerically different, in your survey results. T-tests help you compare group means, evaluate sample differences, and decide whether a gap is statistically significant based on a p-value and confidence level.
Common survey scenarios include:
- Comparing two groups. Use a two-sample t-test (independent samples) to check whether segments like men vs. women, new vs. returning customers, or different employee groups respond differently.
- Testing a concept or treatment vs. control. In A/B testing or concept testing, a t-test helps you see whether one version performs better than another.
- Evaluating score differences. Compare metrics such as Net Promoter Score (NPS), Customer Satisfaction Score (CSAT), or Customer Effort Score (CES) to determine whether one group’s average rating is higher or lower in a statistically significant way.
- Checking changes over time. A paired t-test shows whether the same respondents’ scores changed after an event, feature launch, or campaign.
Use a t-test when you need to assess a difference in means, test a benchmark comparison, or validate a hypothesis with small sample sizes. This makes it a reliable choice for survey analysis, A/B testing, and any situation where you need evidence that a difference in your data is real.
Quick assumption check before running a t-test
Before you run a t-test, make sure your data meets a few basic assumptions so the results are reliable.
- Independent responses. Each answer should come from a different person and not influence another response. Avoid duplicates, shared devices, or hidden clustering.
- Roughly normal mean. T-test works best when the sampling distribution of the mean is approximately normal, which is usually reasonable with when your sample size is about 30 or more per group.
- Reasonable variance. If the variances of the two groups differ a lot or sample sizes are unbalanced, use Welch’s t-test instead of a standard two-sample test.
A quick check on these basics helps ensure that any difference you see reflects a real signal, not noise in the data.
3 common types of t-tests and when to use them
There are three types of t-tests commonly used by researchers. These t-tests serve different purposes that we’ll explain below.
1. One-sample t-test
The one-sample test looks at whether the mean (aka average) of data from one group (in this case, the overall CES) is different from a value you specify.
Example: Your company's current average Customer Effort Score (CES) is 4.2. Is the CES of 4.2 significantly more difficult than the industry standard of 5.0?
2. Two-sample t-test
Two-sample t-tests examine whether the means of two independent groups are significantly different from one another. If group variances look unequal or sample sizes are unbalanced, switch to Welch’s t-test (offered by most tools) because it doesn’t assume equal variances.
Example: Your hypothesis is that men give your company a lower NPS than women. The average NPS from male respondents is 9, while the average score from women is 12. Is 9 significantly different from 12?
3. Paired t-test
This test is for when you give one group of people the same survey twice. A paired t-test lets you know if the mean changed between the first and second surveys.
Example: You surveyed the same group of customers twice: once in April and a second time in May, after they had seen an ad for your company. Did your company’s NPS change after customers saw the ad?
How to conduct a t-test in 4 steps (with example)

There are four steps to performing a t-test.
This section walks through the four steps using the NPS ratings example from the beginning:
Your hypothesis is that men give a lower NPS to your company than women. The average NPS from men is 9, while the average score for women is 12. Is 9 significantly different from 12? This is an example for performing a two-sample t-test.
Let’s dive into the steps and t-test example.
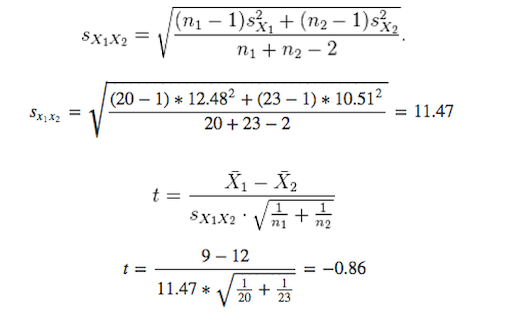
1. Calculate the t-statistic
Each type of t-test has a different formula for calculating the t-statistic. For this example, we’ll use the two-sample t-test formula where:
- t is the t-statistic
- x1 is the average NPS for men → 9
- x2 is the average for women → 12
- n1 is the number of men who responded to the NPS question → say 20 men responded to the survey
- n2 is the number of women → 23 women responded
- s1 is the standard deviation of the NPS for men → say the calculated standard deviation is 12.48
- s2 is the standard deviation of the NPS for women → the calculated standard deviation is 10.51
You’ll probably be conducting the t-tests in a spreadsheet or statistical program (like Excel or SPSS). However, if you’d like to do the math by hand, the formulas for the other two types of t-tests are included below.
2. Calculate the degrees of freedom
Degrees of freedom are the number of ways the mean could vary. In this case, the degrees of freedom are the number of NPS ratings you could have in a given group of respondents. Similar to the t-statistic, the formula for degrees of freedom will vary depending on the type of t-test you perform.
This formula must be used to determine degrees of freedom in two-sample t-tests.

3. Determine the critical value
The critical value is the threshold at which the difference between two numbers is considered statistically significant.
According to this table, for a two-tailed test with an alpha level of 0.05 at 41 degrees of freedom, the critical value is 2.02. Note that most analysts use a two-tailed test instead of a one-tailed test because it’s more conservative.
For more information on the differences between one-tailed and two-tailed tests, check out this video from Khan Academy.
4. Compare the absolute value of the t-statistic to the critical value
If your t-statistic is larger than your critical value, your difference is significant. If your t-statistic is smaller, then your two numbers are, statistically speaking, indistinguishable.
In our example, the absolute value of the t-statistic is 0.86, which is not larger than the critical value of 2.02, so you can conclude that men do not give significantly lower NPS ratings than women.
How to interpret t-test results
Interpreting t-test results includes reviewing the t-value, p-value, and confidence interval to understand whether the difference between your groups reflects a real effect or random variation. These metrics work together to show the size of the gap, the strength of the evidence, and the level of confidence you can place in the result. The Q&A below breaks down what each one tells you and how to analyze t-test results.
What does the t-value tell me?
The t-value shows how large the difference between group means is relative to the variability in your data. A larger absolute t-value means the signal rises above the noise; a smaller one suggests the gap may be due to chance.
What is a p-value in survey analysis?
The p-value indicates how likely it is to observe your results if the null hypothesis (no true difference) were actually true. Many teams use a 0.05 threshold—p ≤ 0.05 suggests a statistically significant difference, while p > 0.05 points to no meaningful difference in this sample.
What is a confidence interval, and why does it matter?
A confidence interval (CI) provides a likely range for the true difference in means, adding context beyond a yes/no significance call. If the CI crosses zero, the effect isn’t conclusive; if it stays above or below zero, the result is significant at your chosen confidence level.
How do you know if a difference is meaningful?
A meaningful difference is both statistically significant and practically important. Look at the estimated effect size and CI to understand how large the gap could be and whether it matters for your decision.
How does sample size influence t-test significance?
Larger samples reduce variability, tighten confidence intervals, and make it easier to detect real differences. Smaller samples introduce more uncertainty, which can make borderline effects harder to interpret.
Presenting your t-test results
A clear t-test results summary shows why you ran the comparison, what the test revealed, and how confident you can be in the difference between groups. Your role is to translate the statistical output into plain language, connect it to the original question, and highlight what the findings suggest for the decisions that follow.
Include these core elements when summarizing t-test results:
- State the purpose. First, share why you ran a t-test and the goal of the test. For example, explain you used a t-test to prove a statistically significant difference between the means of two groups in your survey results.
- Share descriptive stats. Next, highlight the mean and standard deviation for each group being evaluated. This gives stakeholders the necessary context to understand the differences observed. You should also disclose the sample sizes for each group as further context.
- Present the t-test results. Then, share the t-value, degrees of freedom (df), p-value, and the confidence interval analysis (if you did one).
- Share your findings. Lastly, it’s time to share your findings with stakeholders. Briefly discuss whether or not the difference was statistically significant and what that means regarding your hypothesis or research question.
- Offer next steps. Explain to stakeholders what your research findings mean for the company. Share the next steps on how your results could impact business decisions.
Common mistakes when using t-tests in surveys
Avoiding a few simple errors can help you get cleaner, more trustworthy t-test results from your survey data.
- Chasing small p-values without checking the actual difference. A result can be “statistically significant” even when the gap between groups is too small to matter. Consider the size of the difference and the confidence interval to determine whether it’s meaningful.
- Comparing lots of groups without adjusting your approach. Testing many segments or questions increases the chance of finding a difference by accident. Start with a broader test like ANOVA or use basic corrections when running several t-tests.
- Stopping A/B tests too early. Checking results often and ending the test as soon as something looks promising can lead to false conclusions. Decide on a sample size or time window before you begin.
- Using t-tests for the wrong type of data. If your question uses rankings or highly skewed rating scales, a t-test may not be the best fit because the averages can be misleading. Make sure the data behaves enough like a numeric scale.
- Skipping the basic assumptions. T-tests work best when responses are independent, and the groups have reasonably similar variability. If the spread between groups looks very different, switch to Welch’s t-test for a more reliable read.
T-test FAQs
- T-tests vs. ANOVA
- Z-tests vs. t-tests
Build better surveys for analysis with SurveyMonkey
T-tests are used to determine if the difference in the means of two sample groups is statistically significant. You can use t-tests during survey data analysis to validate the reliability of your data.
SurveyMonkey allows you to streamline the process of creating and sending surveys to sample groups for your organization’s research needs. With SurveyMonkey, you can build market research surveys and questionnaires from scratch or tap into our broad selection of over 400 survey templates.
Get started collecting survey data for analysis today to help your organization make better decisions for growth. Create a free account today.
Ready to get started?
NPS, Net Promoter & Net Promoter Score are registered trademarks of Satmetrix Systems, Inc., Bain & Company and Fred Reichheld.
Discover more resources

Solutions for your role
SurveyMonkey can help you do your job better. Discover how to make a bigger impact with winning strategies, products, experiences, and more.

SurveyMonkey Research: AI Sentiment Study
Welcome to our SurveyMonkey AI Sentiment study, a quarterly report designed to measure ongoing changes in AI usage and consumer sentiment.

How Noom validated a bold product idea before launch
Discover how Noom validated their art therapy feature with research using data to understand the deeply subjective experience of emotion and art.

CNBC and SurveyMonkey American Dream Survey
Gen Z men and women have different views on the American Dream and whether they will reach it.