Fifteen years ago, we created the market for online surveys. Today, we’re creating the market for low-cost, effective benchmarking. With today’s launch of SurveyMonkey Benchmarks, we’re helping organizations of all sizes understand how their performance stacks up to peers. Now you get average industry scores alongside your own survey results for added clarity around your organization’s performance.
Using benchmarks gives you context, ultimately providing you with a richer set of results and deeper understanding of your data. Our Vice President of Survey Research, Jon Cohen, explains why this is important in the video below. SurveyMonkey Benchmarks helps you understand how you’re performing compared to others in your industry. You’ll be able to identify strengths, weaknesses, make improvements and set better goals. In essence, your survey results will work harder.
So how are we building these benchmarks? When customers use our expert-certified survey templates and Question Bank, our platform first anonymizes and then aggregates a portion of responses to these questions. These responses are then used to develop powerful indexes organized by industry, location and company size so that you’re able to compare benchmarks from an organization similar to yours.
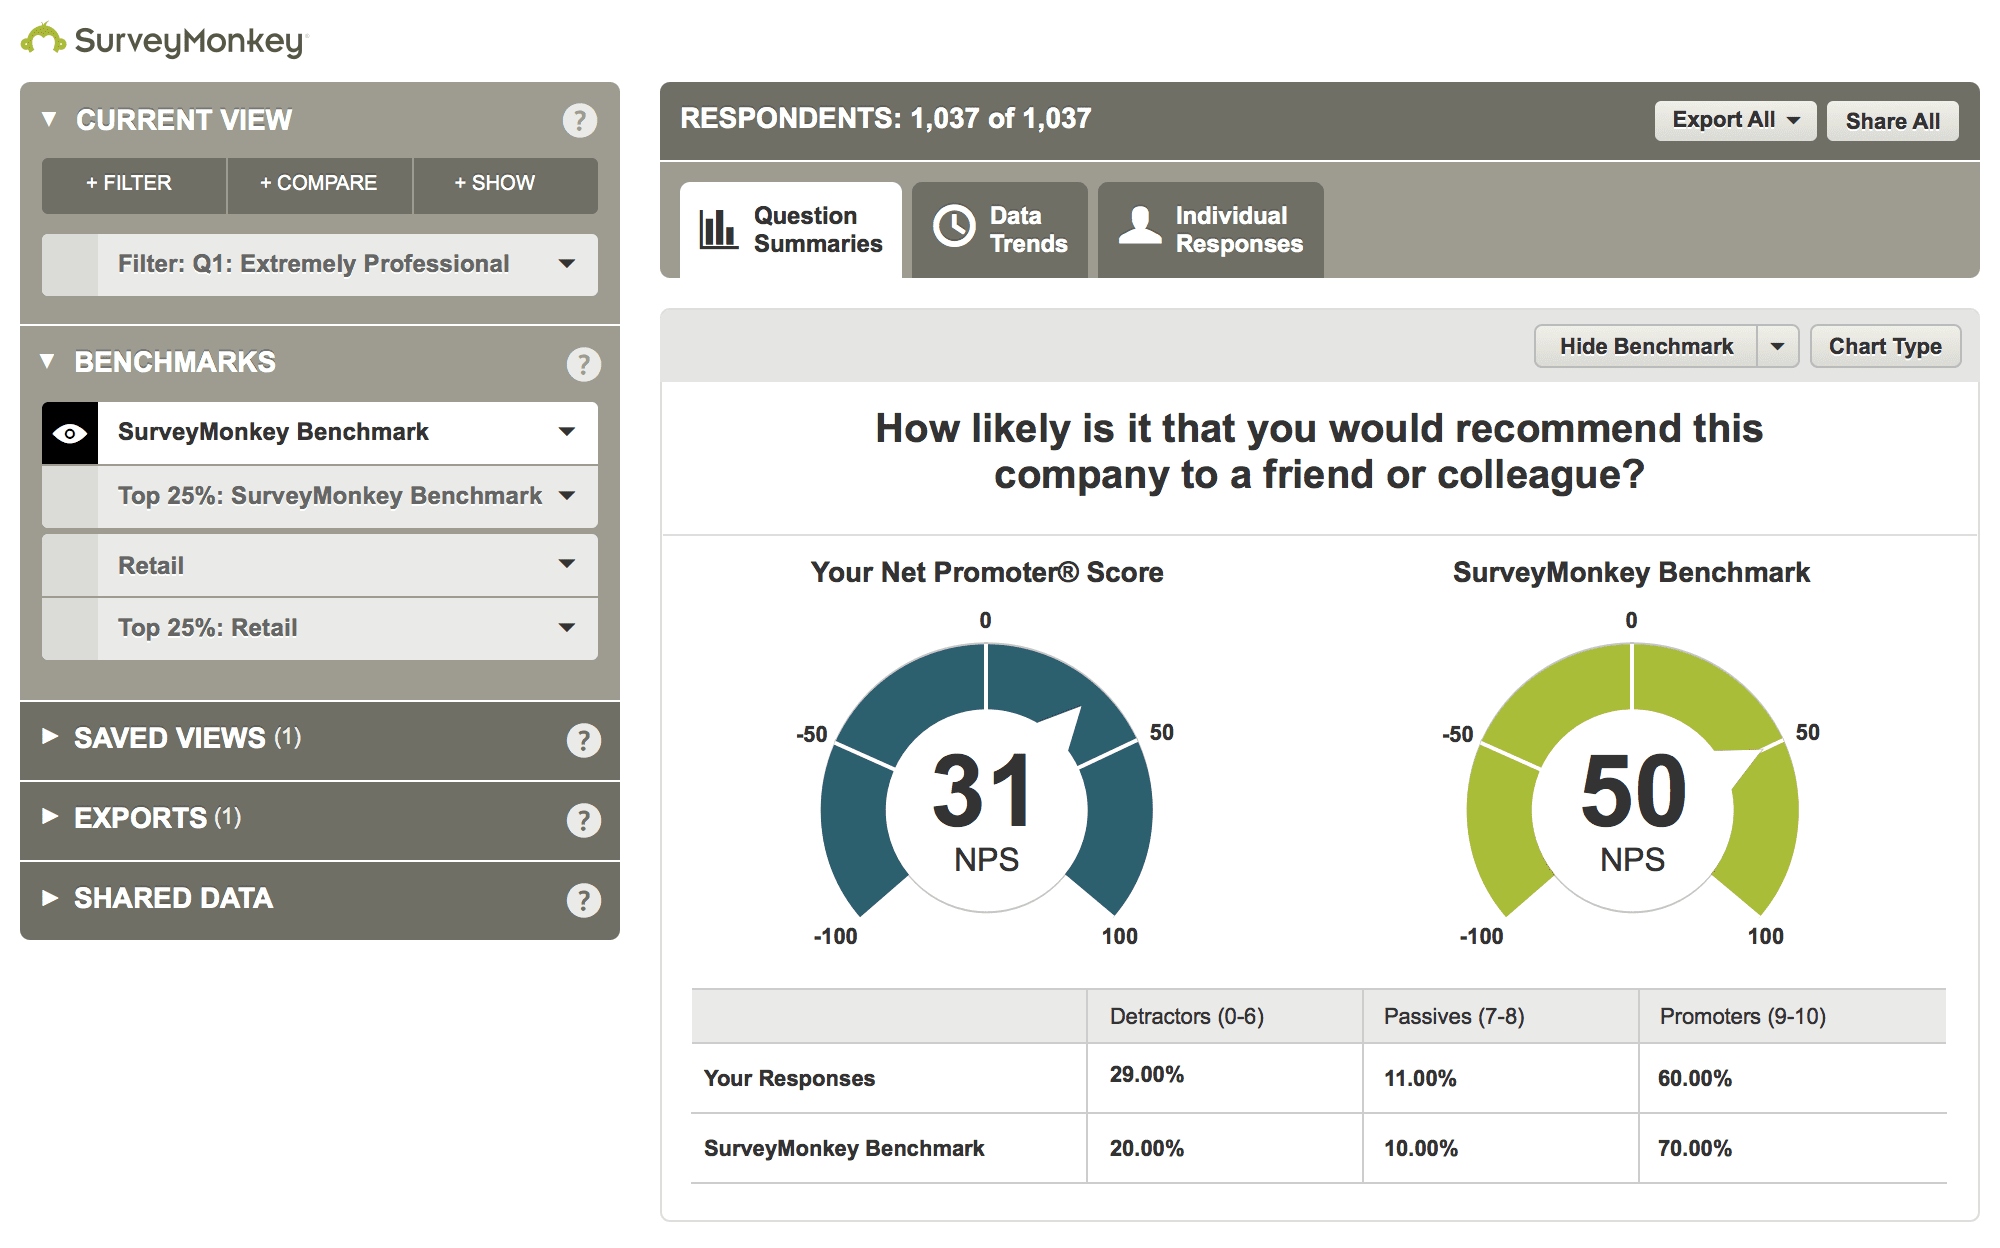
We’re offering four key categories of metrics with SurveyMonkey Benchmarks—employee engagement, customer satisfaction, Net Promoter® Score (NPS) survey questions and website feedback. Once you start using SurveyMonkey Benchmarks, the data you select will automatically appear within your account for easy viewing and analyzing.
To see how SurveyMonkey Benchmarks works, check out our step-by-step tour here.
Stay tuned for additional types of benchmarks in new industries and categories. We’re excited to see the kinds of decisions your organization will make with SurveyMonkey Benchmarks.
Questions, comments? Let us know below!