Hate the player or hate the game? Depending on where their loyalties lie, people may fall into either camp when they consider the issue of how to maintain the data quality of online research – either the respondent is the problem or the survey is the problem.
Intuitively, one would think that the answer is that it is a little bit of both. This is what we have been saying as well, and we have been approaching the problem from both directions.
But what has been unavailable is real evidence on whether there actually are two types of respondents – the “bad” ones and the ones “driven bad” by the survey. Until now. In our recent research on engagement, we looked at the data in a slightly different way that points to this dichotomy in respondent types. While this is not a smoking gun situation, I would say that it falls under a scenario where the barrel is warm and someone has a guilty look on their face.
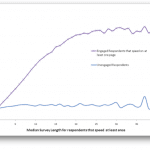
In this research, we analyzed over 1,600 surveys that spanned several months and product categories, and tracked several hundred thousand respondents over time. About 20,000 of these respondents had been unengaged at least once ("unengaged" refers to a respondent that either sped relative to the norm on over 40% of the pages in a survey, or straight-lined while speeding on over 25% of the pages). We looked to see at what point in the survey they started speeding and plotted that against the survey length. In the analysis, we compared the unengaged respondents against those that sped on at least one page in the survey, but not enough to be marked as unengaged.
If there is only one class of unengaged respondent (i.e. those that are driven bad through survey design), I would expect to see a trend of the first time of speeding relative to the length of the survey (i.e. as the survey gets longer, unengaged respondents on average tend to speed later and later). But the finding was quite remarkable in displaying the distinction between the two types of respondents.
As can be seen in the figure below, the respondents that were unengaged in the surveys started to speed right off the bat, and obviously, the length or design of the surveys had no bearing on when the speeding started. However, the respondents that sped on at least one page but were still engaged overall tended to speed much later in the survey, with an average first time of speeding that varies with survey length. Interestingly, the first incidence of speeding flattens out at the 8 minute mark – this appears to be the level where impatience starts to set in. This graph clearly shows the two types of respondents – the “bad” ones that behave badly regardless of the survey, and the ones that are probably driven to do so by the design of the survey.

We will likely encounter both types of respondents in most surveys. It is apparent, therefore, that we need to attack the problem from both sides – design better surveys to keep respondents engaged, and exclude bad respondents to preserve data quality.
Hate the player or hate the game? Why not just find a way to increase the love?


