Exciting news, survey fans! We’ve added some new features that make it easier than ever to analyze the results of an A/B test survey. Now, whenever you include A/B testing in your survey (which shows respondents text, image, or question variants) you can quickly compare the differences in your respondents’ answers based on which version they saw.
What do we mean? Here’s a simple example. Let’s say you’re Coca-Cola and you want to pre-test two logos to see how engaging and professional people think they are.
First, set up an Image A/B Test in your survey using your two images. (Note: Make sure to add text descriptions and a test nickname to make it easy to analyze the results.)
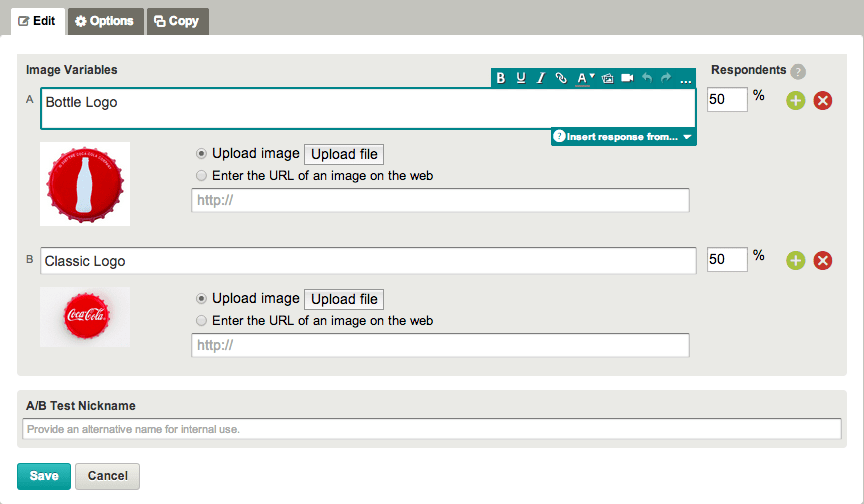
Next, follow that randomized image with two questions about the image. The first asks “How engaging is the logo?” and the second asks “How professional is the logo?”
Each respondent will only see one of the logos and will answer the questions based on the logo they saw.
Know everything about concept testing
Search no more: We wrote the definitive guide so you can test ads, products, logos, packaging, and more on your own.
After receiving responses, go to the Analyze Results tab in SurveyMonkey to see your results. You’ll get a look at the overall totals for the questions about the logo. Let’s say for the first question, you get results like this:

These aggregate results are interesting, but what you really need to know is how engaging the respondents found each logo. Take a look at the Saved Views section to the left of your results. For each A/B test that you create in your survey, SurveyMonkey automatically creates a saved view.

In this example, the automatically-created Saved View is named with the nickname you gave your A/B Test when you designed your survey. Here, it’s Logo Test.
When you click the Saved View named Logo Test, you see that SurveyMonkey has automatically created a Compare rule to compare your results by the variables in your image A/B test.

Now when you look at the results for your two questions, you get to see them side-by-side—so it’s easier to figure out which logo your respondents thought was more engaging.

Clearly, the picture of a bottle was more engaging than just the words, “Enjoy Coca-Cola”. (And you also get the exact numbers in the data table.)

SurveyMonkey also provides other tools to help analyze A/B testing results. If you’re only interested in the response to one of the logos, you can filter results by variable. To do that, go to the Filter rule builder and select Filter by A/B Test.

(Note: You can also create your own Compare rule by selecting Compare by A/B Test under Compare in the rule builder.)
Next, choose which A/B Test you want to use for your filter.

After selecting Logo Test, choose which of the image variables you want to use to filter your results. In this case, check Bottle Logo to see only the responses from people who saw the bottle logo in their surveys.
When you apply this filter, you get filtered results and can see how all the respondents who saw the bottle logo answered any of the questions:

As you can see, respondents thought the bottle logo was very engaging.
With these new analysis tools, A/B tests are easy to create and even easier to interpret after the responses come in. And don’t forget, you can always use SurveyMonkey Audience to get a targeted random sample of respondents to answer your A/B testing surveys.
Did you just finish running an A/B test? Measure the statistical significance of its results in seconds with our calculator.