We’re big fans of analysis over here at SurveyMonkey and thanks to Analyze, we’ve got some pretty nifty ways of doing it. Say you’ve just whipped up a survey, you’ve sent it out to your ideal number of respondents–remembering of course to ask your demographic questions at the end of your survey–and now you’re ready to take a look at all those exciting responses. But not just any look, say you really need to get down into the nitty-gritty with your data.
For example, you want to compare how the responses from the gentlemen in your audience matched up with the ladies’ responses. Or say you want to analyze the responses from folks with graduate degrees with those who’ve earned a bachelors. How do you start? Allow us to introduce you to our Compare feature in Analyze Beta!
Compare, also known as Crosstabulation, is a great way to go into a deeper dive with your data as you’re able to show a side-by-side comparison of two or more survey questions so you can figure out how they relate to each other. Want to see how those close-ended questions of yours match up? Then Compare is the way to go.
We’ll walk you through the steps–let’s get started!
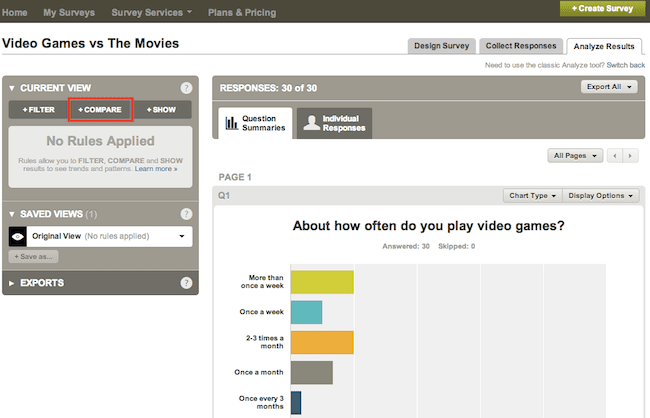
1. After you’ve created your survey, click on the Analyze Results tab. If you haven’t already switched over to Analyze Beta, go ahead and do so. You can always switch back to Classic Analyze.
2. On the lefthand side of the page under Current View, click on Compare.
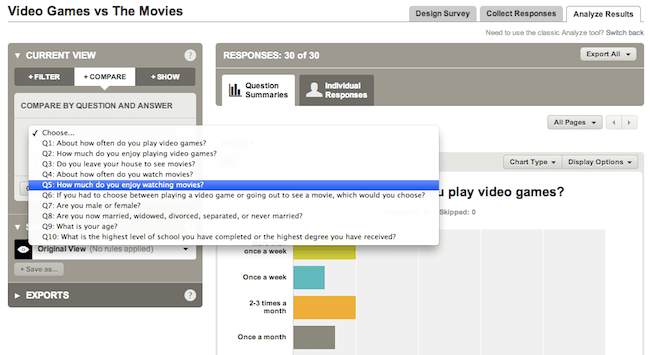
3. Under the Choose… drop-down menu, pick a close-ended question (these will be displayed as black text, and ineligible questions will be grayed out). You can also use the Search feature if you’re working with a lengthier survey.
4. Let’s choose Question 5: How much do you enjoy watching movies? Since the question is black and readable, you know for certain it’s a close-ended question and you’ll be able to compare responses.
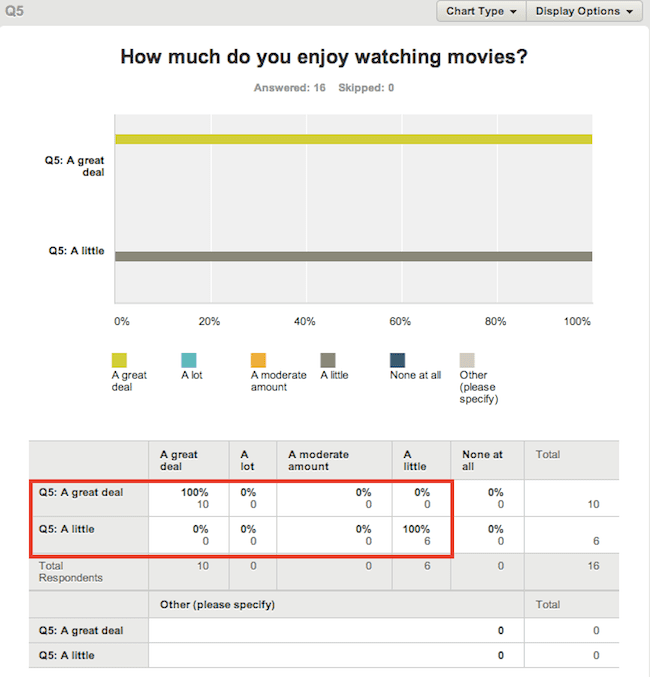
5. We’ll compare those who responded “A great deal” with those who responded “A little”. Tick the checkboxes and click Apply. You’ve now added a Rule.
6. Scroll down to Question 5 and you’ll see how the two answers compare with one another. The individual number of responses and percentages by answer are listed as well. 10 people responded that they enjoyed going to the movies “A great deal” and 6 answered only “A little”.
7. You can add as many Compare Rules as are possible. Now let’s see if there are any differences in how much males or females enjoy watching movies. To do this, you would apply a Compare Rule to Question 7. Following the same steps we did with Question 5, we’ll go ahead and tick both the Female and Male box. Click Apply.
8. Be sure to click on the Rule that you want to view before checking your results. Scroll down to Question 5 and you’ll see that 33% of women enjoy watching movies vs. 30% of males.

9. If you’d like to go back to the View you had before applying rules, you can click on Original View under Saved Views and all of the rules will be deleted.
And there you go–that’s all there is to it.
Remember, the Compare feature is only available on our Paid plans so if you have a free (Basic) account, consider upgrading and get started with comparing and crosstabulating today!