Close-ended questions: When to use them and why
What’s a close-ended question and how do you get quantitative data? Here’s what to know, including question examples, survey examples, and more.

Closed-ended questions are survey questions that give people a fixed set of answer options instead of an empty text box. Sometimes called close-ended or closed questions, closed-ended questions turn opinions and experiences into structured data you can count, compare, and track over time.
Closed-ended questions are the backbone of quantitative feedback, powering everything from quick polls to Net Promoter Score (NPS®) programs and employee engagement dashboards. When they are written well and combined with a few open-ended questions, they help teams move from guesswork to confident decisions.
What is a close-ended question?
Closed-ended questions are survey questions with predefined answer options, such as yes/no, multiple-choice, or rating scales.
Instead of typing a free-response answer, respondents select the option that best matches their view from a list you provide. That list might be short—“Yes” and “No”—or a scale like “Extremely satisfied” to “Extremely dissatisfied,” or a set of labeled categories like “Product,” “Pricing,” and “Customer support.”
Because the options are structured, responses can be turned into quantitative data and sorted for analysis using formats like rating scales and Likert scales. That makes closed-ended questions especially useful when a team needs to summarize results, compare groups, or track trends over time.
There is a tradeoff, though. Respondents often pick the option that is “close enough” to how they feel, even when it does not capture every nuance. Closed-ended questions favor efficiency, speed, and comparability, while open-ended questions favor depth and nuance. For many surveys, the best approach is to use both.
Closed-ended question examples
- Customer service rating
- Question: “Overall, how satisfied were you with your recent interaction with our support team?”
- Attendance check
- Question: “Did you attend last week’s training session?”
In both cases, responses fall into clear buckets that can be counted, summarized as percentages, and compared across groups or over time.
Key characteristics of closed-ended questions
Closed-ended questions tend to share a few core traits:
- Predefined answer list: Respondents choose from set options; there is no free-text field attached to the question itself.
- Limited number of options: The list is finite and intentional, often grouped into 2–10 clear choices.
- Structured data output: Answers produce numeric or categorized data that can feed quantitative research and surveys.
- Fast to answer and analyze: Respondents can respond quickly, and analysts can summarize results using percentages, charts, and statistical significance checks.
- Good for larger samples and tracking: Closed-ended formats scale well to hundreds or thousands of responses and are ideal for repeated tracking studies.
- Common in questionnaires, polls, and standardized surveys: They appear in customer and employee programs, academic research, and many other survey question types.
10 types of close-ended questions with survey examples
Close-ended questions come in many formats, and each one serves different goals, from screening respondents to measuring satisfaction to ranking preferences to testing creative.
Below are 10 common types of close-ended questions, with survey use cases and tips for using each one effectively.
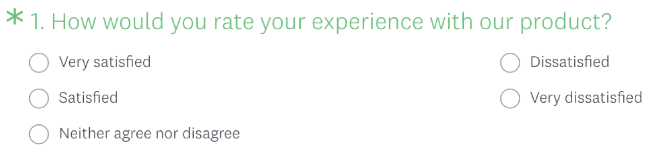
1. Closed-ended multiple-choice questions
Multiple-choice questions let people choose one or more answers from a list of options. They’re flexible enough to capture demographics, behaviors, and opinions, and they often serve as the backbone of customer satisfaction surveys.
You can set multiple-choice questions as single-select (choose one option) or multi-select (select all that apply). Single-select works best when each respondent falls into only one category, while multi-select works well when several options can be true at once.
For example, you might ask:
Which of the following best describes your role?
- Individual contributor
- People manager
- Executive leader
- Other (please specify)
Or you could ask:
Which of the following channels have you used to contact support in the past 6 months? Select all that apply.
- Live chat
- Phone
- In-product help
- Community forum
2. Closed-ended rating scale questions
Rating scale questions ask respondents to choose from a numeric or labeled scale—such as 1–5 or 0–10—to show how strongly they feel. They are a type of ordinal question and power many customer experience metrics, including NPS and Customer Effort Score.
A classic example is the NPS question: “On a scale from 0 to 10, how likely are you to recommend this product to a friend or colleague?” Respondents pick a number where 0 means “Not at all likely” and 10 means “Extremely likely.” That close-ended rating scale feeds the Net Promoter Score Survey Template and enables you to calculate your NPS.
In the workplace, a similar 0–10 scale is used to measure employee Net Promoter Score (eNPS) and employee satisfaction.
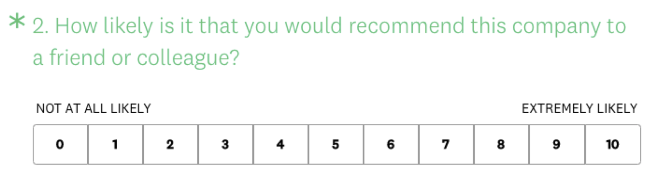
Shorter scales, such as a 5-point scale, are easier for respondents and are common in questions you might see in the Employee Engagement Survey Template, while longer scales, such as the 10-point scale, provide more granularity for tracking loyalty and other key metrics over time.
Once you choose a scale, keep it consistent throughout your survey and label endpoints clearly so people can answer with confidence.
3. Closed-ended Likert scale questions
The Likert scale is a type of rating scale that measures respondents’ opinions, attitudes, motivations, and more. You’ve probably come across a Likert scale close-ended survey question if you’ve been asked how much you agree or disagree with a certain statement.
For example, in employee feedback surveys, employees might be asked to rate how much they agree or disagree with statements like:
- Employee engagement survey: “I feel adequately supported by my supervisor.”
- Belonging and inclusion survey: “When I speak up at work, my opinion is valued.”
- Career development survey: “I am satisfied with my opportunities for professional growth.”
- Workplace benefits survey: “I am satisfied with the amount of paid leave offered by my organization.”
The quantitative results from these close-ended rating scale questions could help an HR professional understand and track the employee experience and make data-driven improvements.
4. Closed-ended matrix questions
Matrix questions group several related items and present them with the same set of answer options, usually in a grid. A series of Likert or rating-scale questions is often combined into a single matrix question so respondents can answer them in a single place.
For example, a team running market research might ask people to rate product features such as ease of use, speed, and reliability on a 1–5 scale within a single matrix. This format condenses multiple questions and makes it easier to compare results across items.
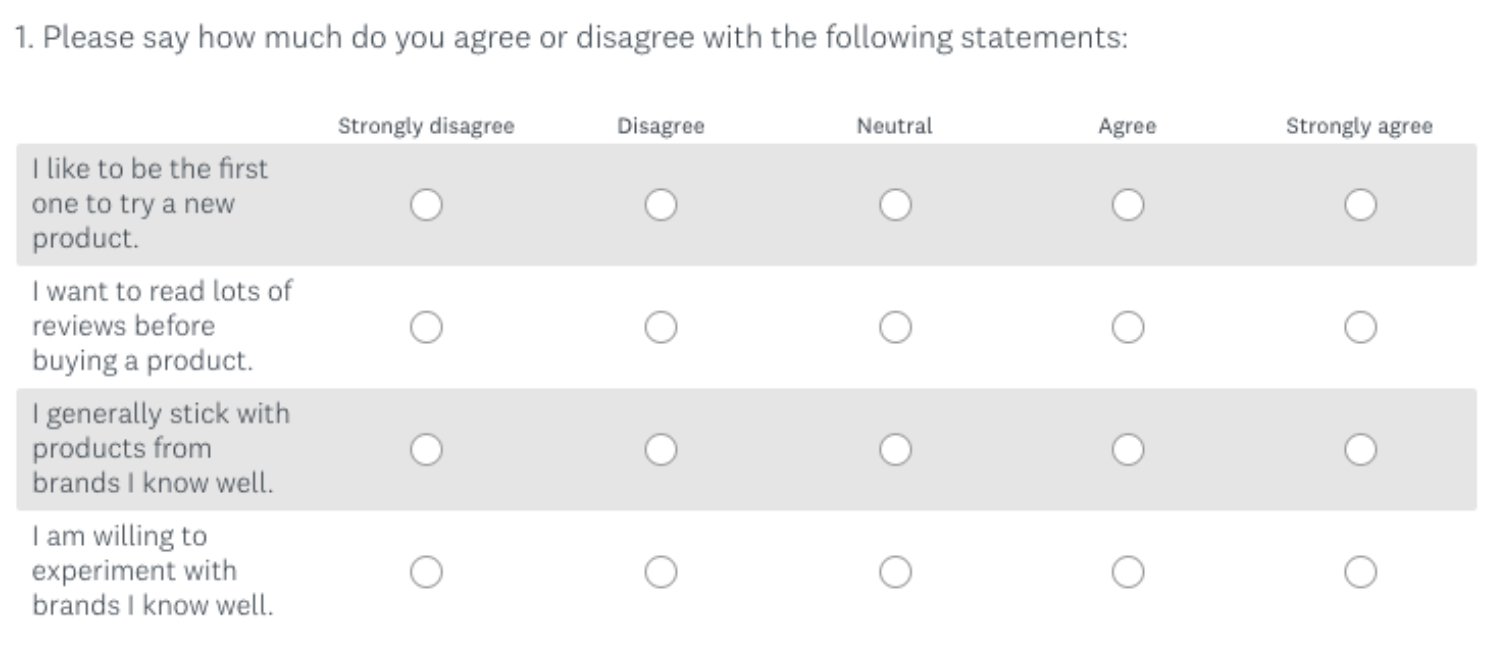
Matrix questions are efficient, but they can be tiring, especially on mobile devices. Keep the number of rows and columns manageable, use clear labels, and consider splitting very long grids into multiple shorter questions to avoid overwhelming respondents.
5. Closed-ended dropdown questions
Dropdown questions present a long list of options in a compact field that people open and scroll through. They’re ideal when you have many options but want each respondent to choose only one.
A marketer running a nationwide study might use a dropdown to collect state or province data instead of listing every location as a separate radio button. You’ll also see dropdown questions used for fields like country or region, year of birth, or highest level of education.

Dropdowns help keep survey pages short and can be easier to work with on mobile than very long multiple-choice lists. Just be careful not to overuse them in situations where a shorter set of visible options would be faster to scan and select.
6. Closed-ended demographic questions
Demographic questions collect information such as age, location, role, and tenure to help you segment your data. Many researchers start from demographic question guidance and then tailor wording and answer options to their audience.
Examples include questions like “Where do you primarily live?” with a country or region list, “Which of the following best describes your role?” with role categories plus an “Other (please specify)” option, or “How long have you been with this organization?” with clear, non-overlapping time bands.

Well-designed demographic questions use inclusive, people-first language and often include options such as “Prefer not to say” when topics are sensitive. When you structure these questions carefully, you can run meaningful demographic segmentation and monitor response rates across groups without forcing anyone into categories that don’t fit.
7. Closed-ended ranking questions
A ranking question asks respondents to place several items in order of preference or importance, often using a drag-and-drop interface. Ranking reveals not only which option people like most, but also how each choice compares with the others.
An event feedback team planning a conference might ask attendees to rank elements such as Networking opportunities, Hands-on workshops, Q&A sessions, Short sessions, and Free registration in order of importance to their experience.
Ranking questions work best when you keep the list relatively short—typically five to seven items—so the task feels manageable. In analysis, focus on which options most often appear in the top positions rather than overinterpreting small differences in exact order.
8. Closed-ended image choice questions
In image choice questions, the answer options are images instead of text. This close-ended format is especially useful when you want to test visual concepts in market research studies like logo design testing, package testing, or ad testing.
You might show several logo concepts and ask, “Which logo concept best fits this brand?” so respondents can select the image they prefer. The image choice question help page walks through how to set up this format.

To keep image choice questions accessible, pair each image with a short descriptive label and add alt text. That way, people using screen readers can participate, and everyone can tell options apart even on smaller screens.
9. Closed-ended click map questions
Click map questions are a specific type of image-based question in which respondents click directly on part of an image rather than choosing from separate tiles. They’re often used to see which areas of a design attract attention, using the click map question type.
For example, an ecommerce team might upload a mockup of a product page and ask, “Where would you click first on this page?” Respondents click on the layout, and the results show click patterns and heatmaps that highlight which calls to action, headlines, or visual elements draw the most focus.

Because click maps aggregate where people interact with an image, they are particularly helpful in optimizing layouts, navigation, and packaging designs.
10. Closed-ended slider questions
Slider questions are interactive rating questions where respondents drag a handle along a scale. They offer the same kind of numerical data as other rating questions, but can make repetitive sections feel more engaging. SurveyMonkey supports this format through the slider question type.
A typical slider might ask, “On a scale from 0 to 100, how confident are you in your ability to use this product?” with 0 labeled “Not at all confident” and 100 labeled “Extremely confident.” Respondents place the slider at the point that best matches their confidence level.
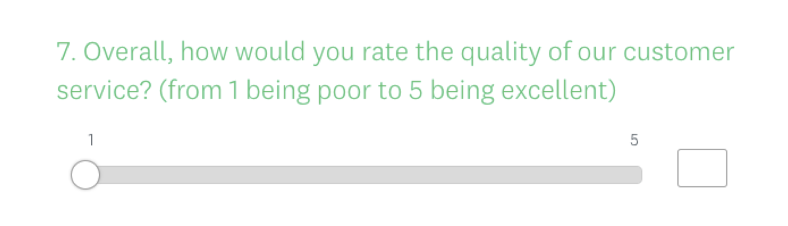
When using sliders, label your endpoints clearly and choose ranges that match the precision with which you plan to analyze the results. Very wide ranges can be harder for people to interpret, while scales like 0–10 or 0–100 usually provide enough detail for most feedback and trend tracking needs.
What’s the difference between closed-ended and open-ended questions?
The difference between closed-ended questions and open-ended questions comes down to whether your question offers pre-determined answer options or a text box where people can share their thoughts or opinions in their own words.
On the plus side, open-ended questions allow for more extensive feedback and give respondents a chance to share personal opinions about a service, product, or experience.
They also allow you to uncover things you may not have considered, but that are important to your customers—which can spark ideas for new close-ended questions.
However, analyzing open-ended questions is not as straightforward as quantitative analysis. For statistically significant results, closed-ended questions are key.
Here’s a quick rundown of close-ended vs. open-ended questions:

When and why to use close-ended questions
Most surveys work best with a mix of closed and open-ended questions. Closed-ended items provide the metrics and categorical data needed for comparisons and dashboards. Open-ended questions add context and ideas that numbers alone cannot provide.
Closed-ended questions are especially powerful when:
- You need to make decisions quickly.
- You need to demonstrate impact using numbers.
- You are working with a large sample or many segments.
When you have a lot of survey respondents
For a nationwide customer survey with thousands of participants, closed-ended questions help by:
- Standardizing responses across people and segments.
- Allowing fast filtering by role, location, or other demographics.
- Feeding sample size calculators and basic statistical checks so results feel reliable.
Inside SurveyMonkey, you can slice this data by segment using filters, compare subgroups, and track change over time—all without exporting to another tool.
When you want to prevent or reduce question fatigue
Typed responses require effort. If every question in a survey asks for a paragraph, people tire out and either drop off or rush through answers.
Closed-ended questions help keep the experience manageable:
- Start with short, focused closed-ended items to build momentum.
- Limit open-ended questions to the most important “moments” in the survey.
- Use consistent scale lengths so respondents do not have to re-learn the format.
This balance respects people’s time and can support stronger response rates.
When you need straightforward answers
Closed-ended data also supports statistical techniques such as cluster analysis, correlation analysis, and hypothesis testing, including t-tests on survey data. These methods require structured, numeric inputs to work.
If a team wants to measure whether a new support process changed satisfaction, or whether a training program improved confidence, closed-ended questions provide the data needed to compare before-and-after results.
When you need data quickly
When time is short—like in a webinar poll, an all-hands meeting, or a quick pulse survey—closed-ended questions make it possible to collect and interpret data within minutes.
Short, specific questions fit well into quick online polls or snack-sized feedback checks during events. The responses stream in as tallies and percentages that presenters can react to in real time.
For ongoing customer programs, closed-ended formats also power metrics such as Customer Effort Score and broader customer experience metrics, which require quick, consistent data from many touchpoints.
Frequently asked questions about close-ended questions
- What is the main difference between close-ended questions and open-ended questions?
- Are close-ended questions qualitative or quantitative?
- Can I use close-ended questions and open-ended questions in the same survey?
- How do I write a closed-ended question?
- Closed-ended questions vs closed-ended questionnaires
Ask better closed-ended questions with SurveyMonkey
Closed-ended questions help teams turn opinions into metrics and patterns they can act on. Whether the task is measuring Net Promoter Score, ranking product features, testing creative, or running quick polls, you can build these questions directly into SurveyMonkey.
Start from expert-written templates, such as those in the survey template gallery, or tap into the SurveyMonkey Question Bank for tested closed-ended items that reduce bias. Then use SurveyMonkey AI to draft or refine questions, suggest answer options, and check your survey design.
Once responses come in, analysis features—from basic charts and filters to survey statistics guidance—help you organize closed-ended data, compare segments, and track change over time.
Whichever closed-ended question types you choose—from classic multiple-choice and rating scales to image choice and click maps—SurveyMonkey lets you design, send, and analyze them in one connected feedback management platform.
NPS, Net Promoter & Net Promoter Score are registered trademarks of Satmetrix Systems, Inc., Bain & Company and Fred Reichheld.
Discover more resources

Solutions for your role
SurveyMonkey can help you do your job better. Discover how to make a bigger impact with winning strategies, products, experiences, and more.

Product feedback surveys
Our product feedback surveys give you the insider knowledge you need to plan new products, grow your business and succeed in today's competitive marketplace. Here are a few ideas on how you can send product surveys, get feedback and develop successful marketing strategies. Get started now.

Why are surveys important in research?
Surveys are important in research because they offer a flexible and dependable method of gathering crucial data. Learn more today.

Survey methodology
How our survey scientists at SurveyMonkey conduct research, collect high-quality data, and uncover insights at an unmatched scale.