More Resources
You’ve sent out your surveys and collected the responses. Now what? It’s time to analyze your data. Correlation analysis of your data can help you understand the relationship between data points, turning insights into patterns and trends within your dataset’s variables. You can then determine which variables need further investigation.
It sounds pretty technical, but we’ve put together helpful information to help you understand how to use correlation analysis with your market research.
Using correlation analysis, you can identify market and customer segments that will help you reach your business goals.
What is correlation analysis?
Correlation analysis is a statistical research technique used to determine if there is a relationship between two variables or datasets. In the area of market research, it’s used to examine quantitative survey data to identify significant patterns, trends, or connections between the variables.
Correlation should not be confused with causation. In correlation, your variables move together. In causation, one variable causes the others to change.
For example, Paula did a study on the relationship between bottled water sales and air conditioner sales. She determined that when air conditioner sales were low, bottled water sales were also low. She also found that when air conditioner sales were high, bottled water sales were high. She concluded that bottled water sales and air conditioner sales are correlated, but she can’t conclude that one causes the other. With further research, Paula found that both variables are caused by an increase in temperature. Therefore, bottled water and air conditioner sales are correlated, and the sales of both have a causal relationship with hot weather.
How is correlation measured?
Correlation is commonly measured using Pearson correlation analysis, though some researchers use the Spearman method. Let’s look at both types of correlation analysis and how they’re used.
Pearson correlation
The Pearson method is the most commonly used correlation method in market research. It’s a way to measure the degree of a relationship between two linearly related variables. It uses the Pearson correlation coefficient test to compare the mean value of the product of the standard scores of matched pairs of observations. This yields an answer in the range of -1 to +1.
To use the Pearson correlation, each variable must be continuous, and the shape of the variable’s relationship must be linear. If these two assumptions are not applicable, you should use Spearman’s correlation.
The Pearson correlation coefficient ( r ) is calculated using this expression:
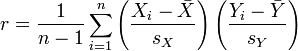
In this calculation:
- Xi represents the values of the x variable
- X-bar indicates the mean of the values of the x variable
- Yi is the value of the y variable
- Y-bar represents the mean of the values of the y-variable
- S indicates the sum of squares of both the x and y variables
- N is the number of observations of the x and y variables
Spearman correlation
The Spearman correlation method is a non-parametric version of the Pearson method. The statistics are not based on assumptions, meaning the data can be collected from a sample that doesn’t follow a specific distribution. The analysis uses the median rather than the mean. As with the Pearson correlation, your data will yield a number from -1 to +1. The closer your number is to 1, the stronger the monotonic relationship.
To use Spearman’s correlation, create a table from your data, ranking the largest number in a column as 1, the next largest value as 2, and so on. Then find the difference in ranks in each row. Square the differences and sum them.
Example:
| Concept | Concept evaluation (0-10) | Concept evaluation ranking | Price willing to pay | Price willing to pay ranking | Difference between rankings (d) | d2 |
| 1 | 9 | 1 | $3.50 | 1 | 0 | 0 |
| 2 | 1 | 4 | $3.20 | 2 | 2 | 4 |
| 3 | 7 | 2 | $3.00 | 3 | -1 | 1 |
| 4 | 3 | 3 | $1.50 | 4 | -1 | 1 |
| TOTAL | 6 |
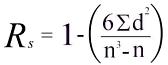
Use the data from your table to calculate Spearman’s rank with the following formula:
Pearson vs. Spearman
Pearson’s correlation determines the strength and direction of the linear relationship between two variables. Spearman’s correlation determines the strength and direction of the monotonic relationship (movement in the same general direction) between two variables.
Both of these methods can be calculated by hand, but you’ll save time and avoid human error if you use a tool to complete the calculations.
What are the types of correlation?
Correlation can be categorized both by how strong the relationship between variables is and the nature of the correlation.
High and low correlation
When variables have a high correlation, they have a strong relationship with each other. Variables with a low correlation are barely related.
Positive, negative, and no correlation
These types of correlations describe the nature of the relationship between variables.
- Positive correlation indicates an increase or decrease in one variable creates a like change in the other variable.
- Negative correlation indicates that an increase or decrease in one variable creates an alternate effect in the other variable.
- No correlation indicates that a change in one variable may not correspond to any change in the other variable.
Why is correlation analysis important?
In marketing, correlation analysis can be used to analyze customer satisfaction, employee satisfaction, and customer experience surveys, among others.
The data gained from correlation analysis is extremely useful in determining areas that need more investigation and may lead to regression analysis for further insights into the relationships between variables.
Correlation data is a critical component of your research into your target market and your employee satisfaction.
Remember, correlation does not indicate causation. Correlation analysis does not allow you to draw any conclusions about a causal effect. You can determine the size, degree, and direction of the relationship, but not causation. This is an important disclaimer that should be indicated within your results.
How can I make sense of survey data with correlation analysis?
When you use correlation analysis, you gain an understanding of how specific variables affect key performance indicators (KPIs) like customer satisfaction or Net Promoter Score® (NPS).
Correlation analysis is also used to measure the effectiveness of advertising campaigns by looking at correlations between increases or decreases in sales related to a specific marketing campaign.
Customer satisfaction surveys (CSAT)
Customer satisfaction is a distinguishing factor used to differentiate your business from the competition. Using customer satisfaction surveys is necessary for gathering data from your customers to guide your business decisions. Satisfied customers often become repeat customers and build brand loyalty.
Analyze the data you collect on your CSAT for correlations that will provide insights into your target market.
For example, you want to know if there is a relationship between sales of a particular product and the demographics of the customer making the purchase. With correlation analysis, you find that your product sales are correlated with males of ages 20-35. This information helps you to target your marketing and advertising, inform product development, and increase overall satisfaction in the demographic segment you’ve identified.
eNPS surveys
Employee Net Promotor Score® (eNPS) correlations to independent variables or organizational factors can be made through employee surveys.
eNPS asks an employee, “How likely are you to recommend working at XYZ company to a friend or family member on a scale of 1–10?” The score serves as the dependent variable.
Further questions ask about independent variables such as salary, benefits, working conditions, company culture, employee morale, opportunities, training, etc.
Correlation analysis of the data will reveal which independent variables have a positive or strong correlation with the eNPS. And this information can be used to determine areas for improvement. eNPS surveys should be administered regularly to track trends over time. As the score goes up, it can be used in recruiting materials to attract high-level candidates.
How to perform a correlation analysis
Use the following steps to perform your own correlation analysis:
- Design your survey: Ensure that your questions yield data that is numerical and ordinal, such as:
- Age
- Income/money
- Satisfaction scales
- Importance scales
- Test your survey: Ensure that all questions are functioning so that data will be correct and valid.
- Administer your survey, and then collect and clean your data.
- Run your correlation analysis using the Pearson or the Spearman analysis method.
- You can calculate manually for variables or save time and potential for human error by using a program like Excel.
- If you’re familiar with entering functions in Excel, you could enter the CORREL command: =CORREL(array 1, array 2)
For example, =CORREL(A3:A8, B3:B8)
- You can also load the Excel Data Analysis Tookpak, which includes several types of analysis tools. Here’s how to do it:
- Type your collected data into an Excel worksheet. Use two columns to place your x and y values in the table.
- Click “Data” and “OK.”
- Click “Correlation,” then “OK.”
- Enter the location for your x-y variables in the “Input Range” box.
- Click either “columns” or “rows” to indicate how your data is arranged (usually it’s columns).
- Check “Labels in first row” if you have column headers.
- Click “Output Range” and select where you want your output to appear on the worksheet.
- Review results for correlations between variables.
Begin using correlation analysis in your research
Does your market research include correlation analysis? While it doesn’t reveal causal relationships, it does provide you with important information that can be used in your analysis of employee and customer satisfaction and more.
Get started today with a survey sent to your target audience. SurveyMonkey Audience will send your survey to the exact participants you need. And check out all of our market research solutions to help you run your business today!
Net Promoter®, NPS®, NPS Prism®, and the NPS-related emoticons are registered trademarks of Bain & Company, Inc., Satmetrix Systems, Inc., and Fred Reichheld. Net Promoter Score℠ and Net Promoter System℠ are service marks of Bain & Company, Inc., Satmetrix Systems, Inc., and Fred Reichheld.
Get started with your market research
Global survey panel
Research services
Expert solutions
To read more market research resources, visit our Sitemap.