Are you ready to start making strategic decisions based on your new insights?
Not quite. There’s a step between receiving your responses and analyzing them that’s crucial: survey data cleaning.
Survey data cleaning involves identifying and removing responses from individuals who either don’t match your target audience criteria or didn’t answer your questions thoughtfully.
If done right, it gives you an improved set of responses that allows you to make better decisions. And if ignored or done poorly, it can limit your ability to capture valuable insights and reduces the credibility of your findings.
We’ll walk you through the most common cases for performing survey data cleaning, and show you how to do it in SurveyMonkey. That way, you’ll know how to keep your results representative of your respondents’ experiences before you analyze them.
When to perform survey data cleaning
When deciding which respondents to exclude from your analysis, you’ll need to review the nature of their responses and their background.
Here are 7 criteria you should consider as you decide whose responses to filter out or remove:
1. Respondents who only answer a portion of your questions
Respondents who answer just a fraction of your required questions can bias your overall results for many reasons:
- It can be a sign that they weren’t qualified to take your survey to begin with (leading them to leave).
- It can indicate that they weren’t as engaged and considerate in their responses as those who were willing to complete it.
- When you're working with an incomplete dataset, using filters or Compare Rules may not show you the full picture, but offer a partial (and potentially skewed) view instead.
Note: If many respondents didn’t complete your survey, it can also mean that there were issues in your survey design (like including irrelevant questions, asking too many questions, using broken survey logic, etc.).
In SurveyMonkey, you can easily filter responses by completeness. To do so, visit your survey’s “Analyze Results” page. From there, click on “+ Filter” and then filter by "Complete responses.”
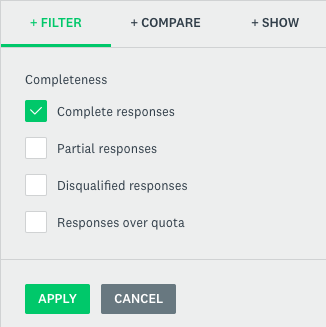
You’ll be able to check off and apply “Complete responses,” to only see feedback from people who answered all of your survey’s required questions and clicked “Done” on the last page.
Get the survey data you need
Get complete responses from your target market with SurveyMonkey Audience.
2. Respondents who don’t meet your target criteria
Say you want to survey women between the ages of 18 and 29.
You wouldn’t want the responses of a 50-year-old influencing your overall findings, would you?
Whatever audience specifications you land on, you can ignore respondents who don’t match them by filtering them out.
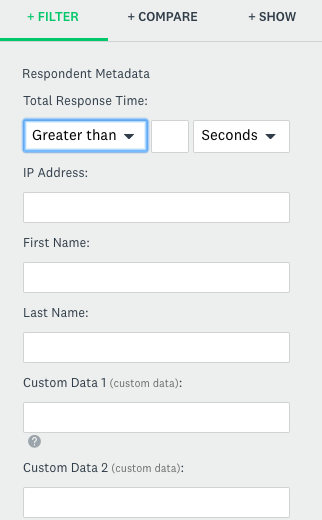
And if you didn’t ask a question that determines whether or not a respondent matches your target criteria? You can still add the relevant information retroactively by creating and filling out a custom data field for each respondent (in the example above, the custom data field can be age). Then, you can filter by your custom data to focus on the responses you care about.
Pro tip: You can prevent certain groups of individuals from taking your survey by asking a screening question right at the beginning. Learn more about using this type of question by reading our guide.
3. Respondents who speed through your survey
Imagine sending a respondent a 10-question survey.
If they only take a few seconds to complete it, they’re likely speeding through the questions, which means they aren’t reading them carefully and answering them thoughtfully.
So how do you go about deciding who’s a speeder and who isn’t? The answer can vary, depending on the subject of your survey and the types of questions you ask.
To identify speeders on your survey, find the average response time among all of your respondents. This tells you the “normal” time it takes respondents to complete your survey.
Then, try to establish certain rules for picking out speeders, like: the fastest “X number” of respondents who take your survey, or the “X%” of respondents who take your survey the fastest. If that sounds too complicated, just kick out individuals whose response times are much shorter than normal (but do so conservatively).
You can spot your speeders in a few different ways:
- Filter the response time by respondent if you only have a few individuals who took your survey.
2. If you have more than a handful of respondents, export “All responses data.” The downloaded file will show you how much time each respondent spent on your survey.
Once you identify your speeders, you can delete their responses.
4. Respondents who “straightline”
Straightlining is when a respondent chooses the same answer choice over and over again (e.g. the first answer option). Straightliners are often speeders as well, as they race through the survey by answering each question with little to no thought.
To spot your straightliners, quickly, export your responses into an excel document or a statistical software. After you find them, you can delete their responses.
5. Respondents who provide unrealistic answers
Imagine asking respondents how much TV they watch per week, on average. If a respondent writes in 165 hours, they’re likely exaggerating (Hint: there are only 168 hours in a week).
We call this type of response an outlier, because it falls beyond the range of answers from our other respondents, and is, quite frankly, unrealistic.
Like finding straightliners, you can use an excel document or a statistical software to identify your outliers. And once you have, you can delete their responses.
Related reading: Get the right survey data from customers, prospects, and more.
6. Respondents who give inconsistent responses
When a respondent’s answer contradicts their response to another question, it’s clear that they’re either being dishonest or careless (or even both!).
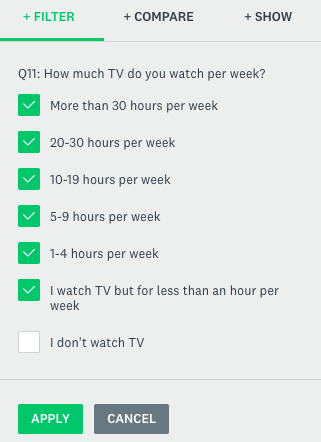
You may be able to find these inconsistencies by applying multiple filters. For instance, say that one of your survey questions asked respondents how much TV they watch per week. When the responses come back, you filter by those who said they watch at least a little.
On another question in your survey, you asked respondents which shows they like the most. Once you’ve finished collecting feedback, you also filter the responses by the answer choice: “I don’t watch TV.”
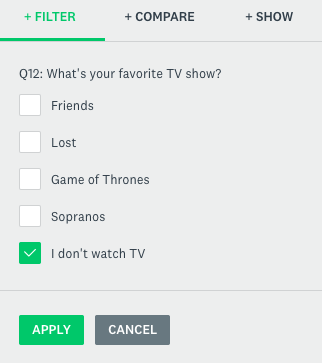
After you apply both of these filters, any responses that show up are inconsistent—as these respondents said that they don’t watch TV in one question and then admitted to watching TV in another.
Alternatively, you can pick out inconsistencies after exporting your results into an excel document or a statistical software.
In either case, once you spot respondents who provide inconsistent responses, you can go ahead and delete their feedback.
7. Respondents who offer nonsensical feedback in your open-ended questions
Having a response like: “Fdsklj” might make you smile, but it isn’t going to get you far in your analysis.
To surface these types of responses early on, review your open-ended feedback in SurveyMonkey. You can then delete the responses that are clearly gibberish.
Pro tip: A response like “none,” as well as those with misspellings shouldn’t be deleted. In the former, the respondent may not have found the question to be relevant; while in the case of the latter, the respondent could have mistaken the correct spelling or made a simple typing error.
Another option involves tagging each response that makes sense. Then, once you’ve finished tagging, you can simply filter by the tags to exclude any nonsensical feedback.