Pearson vs. Spearman correlation: Understanding the key differences and when to use each
So you’ve gathered your data, and now you want to determine whether there’s a relationship between two key variables. Find out how to do just that.

Choosing between Pearson vs. Spearman correlation means choosing how you model the relationship between two variables. The right choice helps you align your data, assumptions, and research questions so your findings remain reliable.
We’ll take a look at what each technique involves, when each should be used, and the types of research questions that could be addressed. Also, if you are conducting usage and attitudes (U&A) research or concept testing, we can perform the analysis for you.
What is correlation?
Correlational analysis is a bivariate (two variable) statistical procedure that sets out to identify the mean value of the product of the standard scores of matched pairs of observations.
In survey research, correlation helps you see whether changes in one measure tend to line up with changes in another.
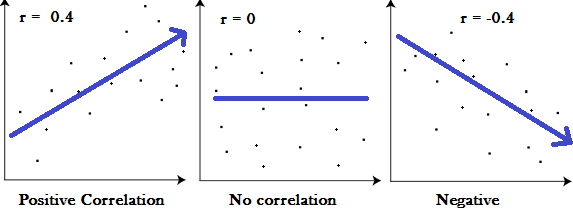
- A positive correlation means higher values on one variable tend to come with higher values on the other.
- A negative correlation means higher values on one variable tend to come with lower values on the other.
- A correlation near zero suggests no clear pattern.
Correlation on its own never proves causation; even a very strong correlation does not tell you which variable drives the change. When you use correlation in survey data, you move from individual answers to patterns in the whole dataset, which is why it often appears in performing correlation analysis with survey responses.

Pearson correlation method
What is the Pearson correlation coefficient?
Pearson correlation measures the strength of a linear relationship between two variables—which can be used to find out if there is strong association between one variable versus another.
Imagine you have two variables—such as employee engagement and employee salaries—plotted on a simple scatter plot graph. The Pearson correlation essentially tries to utilize a scatter plot by drawing a line through the data in order to find out whether the two compariables are covary with one another and to what extent.
That is, Pearson correlation coefficient identifies whether:
- There is a positive correlation between the two variables. That is, whether an increase in employee engagement is associated with an increase in salaries.
- There is a negative correlation between the two variables. More specifically, whether a rise in salaries is associated with a reduction in employee engagement, or vice versa.
- There is no relationship between the variables. In other words, changes in salaries and employee engagement are unrelated to one another.
Insight into this relationship is a first step in understanding how variables of interest might relate to one another, and could also prompt further causal investigation.
Pearson correlation coefficient formula
The Pearson correlation coefficient, r, is calculated with this expression:
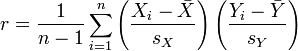
Where:
- xi = the observed values of variable X
- x̄ = the mean of the X values
- yi = the observed values of variable Y
- ȳ = the mean of the Y values
- S = the sum of the squares of the x and y variables
- N = the number of observations of x and y variables
- The numerator shows how the X and Y deviations move together
- The denominator rescales those joint deviations by the sum of squared differences for each variable
The result always falls between –1 and +1. The sign shows direction (positive or negative), and the magnitude shows how tightly points cluster around a straight line.
When to use Pearson correlation
Use Pearson correlation when your goal is to measure a linear relationship between two continuous variables under fairly standard statistical assumptions:
- Variables are continuous.
- Relationship is roughly linear.
- The distribution is not strongly skewed and doesn’t include extreme outliers.
Understanding Pearson results
The Pearson correlation coefficient test compares the mean value of the product of the standard scores of matched pairs of observations. Once performed, it yields a number that can range from -1 to +1.
Positive figures are indicative of a positive correlation between the two variables, while negative values indicate a negative relationship. Furthermore, the value of r represents the strength of the relationship. A Pearson’s r that is near the value of 1 is suggestive of a stronger relationship between the two variables.
As a rule of thumb, the following values can be used to determine the strength of the relationship:
- A Pearson correlation coefficient of between 0 and 0.3 (or 0 and -.03) indicates a weak relationship between the two variables
- A Pearson correlation coefficient of between 0.4 and 0.6 (or -.04 and -.06) indicates a moderate strength relationship between the two variables
- A Pearson correlation coefficient of between 0.7 and 1 (or -.07 and 1) indicates a strong relationship between the two variables.
Example
Imagine that you’ve developed some marketing concepts that you’ve begun testing with some potential customers. For each concept, you’re interested in learning whether evaluations of the appeal of the concept are associated with stronger intent to purchase.
Comparisons of Concepts A, B and C yield Pearson correlation coefficients of .3 .6 and .9 respectively. Based on these three figures, you can infer the following:
- For all three market concepts, there is a positive correlation between evaluations of concept appeal and intent to purchase the purchase
- However, the correlation between concept appeal and intent to purchase is strongest for Concept C, and weakest for Concept
- For Concept B, there is positive correlation between concept appeal and purchasing intent but the relationship is moderate
Using these inferences, you might decide that Concept C is the most appropriate concept to employ in your next marketing campaign.
Practical applications of the Pearson correlation coefficient
Pearson correlation is a workhorse for continuous survey metrics and KPIs. Examples include:
- Customer metrics: Check whether higher satisfaction scores align with higher repeat purchase intent or higher spend.
- Employee metrics: Relate an employee engagement index to intent to stay or self-reported performance.
- Brand and marketing metrics: Explore whether brand awareness scores correlate with preference or likelihood to recommend.
- Product metrics: Tie time in product or feature usage to a product satisfaction scale.
In each case, Pearson correlation gives an at-a-glance sense of whether higher scores on one variable are associated with higher (or lower) scores on another, under a linear relationship model.
Spearman correlation method
What is the Spearman correlation coefficient?
The Spearman correlation test examines whether two variables are correlated with one another or not.
The Spearman’s test can be used to analyse ordinal level, as well as continuous level data, because it uses ranks instead of assumptions of normality. This makes the Spearman correlation great for 3, 5, and 7-point Likert scale questions or ordinal survey questions.
Spearman correlation formula
Spearman’s ρ is computed by:
- Ranking each variable (largest value gets rank 1, next largest rank 2, and so on; ties get the average rank).
- Comparing how far apart those ranks are for each pair of observations.
For data without many ties, Spearman’s rho is often written as:
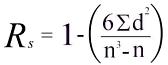
Where:
- di = the difference between the rank of X and the rank of Y for each observation
- di² = the squared difference in ranks for each observation
- Σdi² = the sum of all squared rank differences
- n = the number of paired observations
- The denominator n3−nn^3 - nn3−n is an algebraic form of n(n2−1)n(n^2 - 1)n(n2−1); both express the same scaling factor
- The entire fraction adjusts how large the summed rank differences are relative to the sample size
When to use Spearman correlation
Spearman correlation is helpful when the data or relationship does not fit Pearson’s assumptions:
- Ordinal or rank-based data.
- Monotonic relationships that may not be linear.
- Non-normal or skewed distributions.
- When Pearson assumptions are violated in U&A or concept testing.
Spearman helps you measure relationships even when the data doesn’t follow typical statistical assumptions.
Understanding Spearman results
The Spearman’s rank-order tests determine the strength and direction of the monotonic relationship between two variables measured at ordinal, interval or ratio level.
As with the Pearson equivalent, the test will yield a figure of between -1 and +1, and the closer the figure is to 1, the stronger the monotonic relationship. As a rule of thumb, you can use the following figures to determine the effect size:
- A Spearman’s correlation coefficient of between 0 and 0.3 (or 0 and -.03) indicates a weak monotonic relationship between the two variables
- A Spearman’s correlation coefficient of between 0.4 and 0.6 (or -.04 and -.06) indicates a moderate strength monotonic relationship between the two variables
- A Spearman’s correlation coefficient of between 0.7 and 1 (or -.07 and 1) indicates a strong monotonic relationship between the two variables.
In addition, probability values should be used to determine statistical significance.
Example
Imagine you’ve gathered some data on evaluations of a market concept, and the average price a consumer is willing to pay. Take the following steps:
- In the first instance, you should create a table from your data. Each set of measurements should be ranked by assigning the ranking 1 to the largest number in a column, 2 to the next largest value, 3 to the third largest and so on (tied scores can be assigned the mean rank).
- Then, find the difference in the ranks (d). This is the difference between the ranks of the two values on each row, calculated by subtracting the ranking of the second value (in this example, price) from the rank of the first (concept evaluation).
Finally, square the differences (d2) and then sum them.
| Concept | Concept evaluation (0-10) | Concept evaluation ranking | Price willing to pay | Price willing to pay ranking | Difference between rankings (d) | d2 |
| 1 | 9 | 1 | $3.50 | 1 | 0 | 0 |
| 2 | 1 | 4 | $3.20 | 2 | 2 | 4 |
| 3 | 7 | 2 | $3.00 | 3 | -1 | 1 |
| 4 | 3 | 3 | $1.50 | 4 | -1 | 1 |
| TOTAL | 6 |
In our example, we would first multiply the sum of the d2 values (6) by 6 (i.e. 36). To address the denominator, we would raise the number of observations (concepts) to the power of 3 and then subtract the number of observations (i.e. 43-4 = 60). We can then calculate Spearman’s rho as 1-36/60= -.058.
This indicates a moderate, negative monotonic correlation between concept evaluation and the price that consumers are willing to pay. A difficult one to interpret!
Practical applications of Spearman’s correlation coefficient
Spearman correlation shines when you’re working with ordinal scales, ranks, or skewed distributions. Common uses include:
- Customer research: Relate ranked brand preferences to a ranked likelihood to recommend. And examine whether higher satisfaction bands (on a Likert scale) tend to match higher loyalty tiers.
- Employee research: Connect career growth agreement scores on a Likert scale to intent to stay buckets.
- Usage and attitudes (U&A) studies: See whether higher preference ranks for features line up with frequency of use categories.
- Ranking-based concept tests: Compare how concept rank on appeal aligns with rank on purchase priority.
Because it relies on ranks, Spearman correlation stays more stable when a few outliers or oddly spaced responses would distort a linear correlation.
Pearson vs. Spearman correlation methods
This is the core Pearson vs. Spearman correlation question: both coefficients measure association between two variables, but they rely on different assumptions and highlight different patterns.
The table below summarizes the difference between Pearson and Spearman correlation at a glance:
| Aspect | Pearson correlation | Spearman correlation |
| What it measures | Strength and direction of a linear relationship between two variables | Strength and direction of a monotonic relationship between two variables based on ranks |
| Data type | Continuous variables (interval or ratio) | Ordinal or continuous variables that can be ranked |
| Key assumptions | Relationship is approximately linear; distributions are not extremely skewed; limited extreme outliers | Relationship is monotonic; fewer distributional assumptions; robust to skew |
| Outliers | Highly sensitive—single extreme values can strongly affect r | Less sensitive—rank transformation reduces the influence of outliers |
| Typical survey uses | Continuous KPIs (indexes, composite scores, scaled financial metrics) | Likert scale items, rank-ordered choices, non-normal or skewed scores |
| When it fits best | When you expect a straight-line pattern between two metrics | When you expect a consistent direction (up or down) but not a straight line |
In practice, analysts often calculate both Pearson and Spearman correlations when working with mixed data types or when they want to check how much linear and monotonic perspectives agree.
Usage and attitudes for correlation analysis
So, that’s correlation in a nutshell, and how and when to use it. It can be complicated, but the good news is that if you’re planning on a usage and attitudes (U&A) survey or performing some concept testing, we can handle the correlation analysis for you through our Key Driver Analysis feature.
Get started with your market research
Global survey panel
Collect market research data by sending your survey to a representative sample
Research services
Get help with your market research project by working with our expert research team
Expert solutions
Test creative or product concepts using an automated approach to analysis and reporting
To read more market research resources, visit our Sitemap.