
Before you can analyze survey responses and uncover valuable insights, data cleaning is a must. It helps ensure that you only spend time analyzing responses that are relevant and accurate—so you can go forth and make data-driven business decisions with confidence.
Data cleaning involves identifying and eliminating any responses that are poor quality or don’t reflect your target audience. It’s best practice for any survey project, especially if you want to verify the results of surveys that use website collectors, social media, or incentives to collect responses.
Despite being such an important pre-analysis step, data cleaning doesn’t always get the love it deserves. Some survey creators find it time consuming and subjective and, according to our research, up to 70% skip it altogether. Luckily, there’s a way to make the process easier. Our Response Quality analysis tool (available on paid plans) automatically identifies and flags poor-quality responses so you can get to the good stuff—i.e. game-changing results—that much quicker.
How it works
The Response Quality tool uses machine learning, in combination with real user feedback, to scan open-ended and multiple choice survey questions and flag poor-quality responses.
For example, if a respondent answers C on every question or speeds through your survey in a questionable amount of time, it suggests that they didn’t thoughtfully complete the survey. Since this makes their answers less accurate, we’ll flag these responses so you can review them. You can then choose whether to keep them for your survey analysis or remove them so you can focus on the more high-quality data you receive.
Here’s where the machine learning comes in: If you ever think that we’ve incorrectly flagged a response, you can click “Not poor quality” to remove the flag. This improves flagging accuracy in the future and keeps your analysis on the right track.
To turn Response Quality on, first make sure that you’ve opted in to Automatic Insights. Then follow these steps:
- Go to the Analyze Results section of your survey
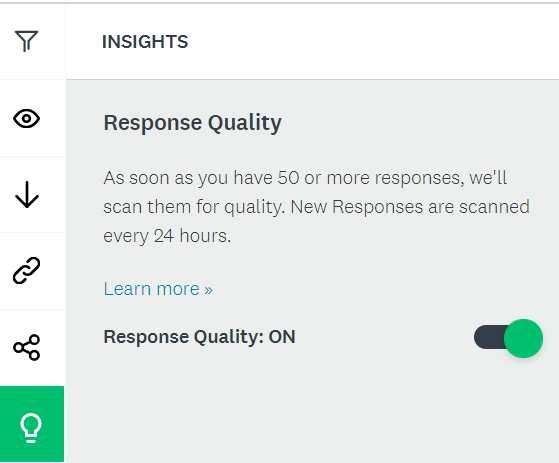
- In the Insights section of the left sidebar, click on Response Quality. Then click the toggle On.
Once your responses are scanned, you can scroll through Individual Responses to find responses flagged as Poor Quality. Keep in mind, your survey needs to have more than 50 responses to use this tool and survey results collected before March 2, 2020 can’t be reviewed for quality. In addition, the tool cannot currently be used with surveys that use SurveyMonkey Audience.
What’s considered a poor-quality response?
The Response Quality tool scans for the most common types of poor-quality responses and flags them for you to review:
- Straight-lining: Multiple questions have been responded to with the same answer option or in a pattern. For example, the respondent chose option C for every question.
- Profanity: The survey response includes a curse word.
- Speeding: The respondent took significantly less time to complete the survey than other people.
- Gibberish: The response includes a text response that’s primarily made of nonsensical words, like “asdfjkl.”
- Length: The response is significantly shorter than other responses.
- Not a full word: The response includes a 1-character answer that’s not a word.
- Copy-pasted answer: The response matches the question text.
Remember, data cleaning is a subjective process. The Response Quality tool does a lot of the initial work, but you’ll still need to review the questionable behavior that it flags. To determine what’s questionable for each survey, you’ll want to consider the type of survey and your respondent group.
For instance, let’s say you’re surveying people about an extremely divisive current event. You may feel that responses with profanity are still valuable for your analysis. While the Response Quality tool will identify those responses as poor quality, you’re the final say in data cleaning and your judgement is still needed.
Better quality responses, better survey analysis
This handy automated data cleaning tool provides a fast, accurate, and easy way to weed out poor-quality responses—without introducing your own potential bias into the process. With this tool to help guide your data cleaning, you can:
Save time
The Response Quality tool automatically flags poor-quality responses, reducing manual review time. That means you can spend more time on what matters—the high-quality data that leads to real insights.
Make decisions confidently
Credible data drives action. When you have good data, you can feel confident about making strategic decisions based on new insights.
Get trustworthy insights
Easily avoid personal bias when cleaning your data. The Response Quality tool will do an initial objective determination of the quality of your responses.
If you’re conducting your own response quality analysis, keep the poor-quality responses we’ve mentioned in mind as you sift through your data. Ready to give the Response Quality tool a try? Automate your data cleaning and get the most out of your survey analysis.