By Mark Blumenthal and Erin Pinkus
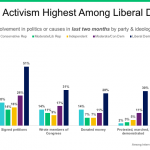
In the wake of the election of Donald Trump, Americans on the political left are reporting a wave of activism far surpassing that reported by others across the partisan spectrum. According to new results from SurveyMonkey’s ongoing tracking surveys of the American public, self-described liberal Democrats are roughly twice as likely as other Americans to say they engaged in various forms of political activism in the first few months of 2017.
From the surge in donations to Democratic campaigns, the ACLU and other progressive causes, to the Women’s Marches following Trump’s inauguration, to airport protests of the new administration’s executive order on immigration and overflow crowds at congressional town hall meetings, the news of early 2017 has been full of reports of greater grassroots activism on the political left. Our recent survey helps quantify the degree to which this new activity currently exceeds reports of activism on the political right.
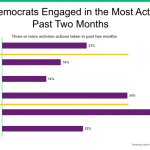
Roughly two-thirds of Americans tell SurveyMonkey’s tracking survey that they were involved in politics or causes in their community in some way over the past two months, with mentions highest for sharing opinions on social media (34 percent mention), voting (29 percent), and signing petitions (26 percent).

Rather than focus on the precise level of reported activity, these data are better used to compare variation in reported activism among subgroups of Americans, and on that score, the results are clear and consistent: Liberal Democrats are far more likely to report various kinds of political activism. So much so, almost half of liberal Democrats (47 percent) report at least three or more activism actions in the past two months—double that of what adults overall report.

The pattern extends to most of the activities we asked about including sharing opinions on social media, signing petitions, writing members of congress, making donations to campaigns or political organizations, and attending local meetings. In each case, the percentage of liberal Democrats reporting activism is roughly double that of most other Americans.

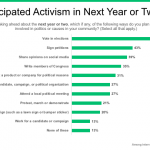
Similar patterns appear for anticipated political activity over the next year. The percentages saying they plan to participate is typically higher for most of the activities we asked about compared to reports for the last two months, and in some cases, may seem unrealistically high. Many survey respondents will overstate their likelihood of participating in socially desirable behavior, such as voting, and the differences by subgroup are of greater interest than attempting to predict the absolute level of activism.

When thinking ahead to the next year or two, the political left is again more likely to report plans for political activism than the political right and other subgroups of Americans. Again, across a half dozen types of political activity, self-described liberal Democrats are typically twice as likely as other voters to report plans for activism. Conservative Republicans report plans for activism more often than other Republicans or independents, but their planned activism still falls significantly short of liberal Democrats.

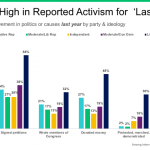
While greater activism on the left likely represents a shift since the election, it is not obvious from a third set of questions that asked about political activity “last year.” Yes, the overall results to this query do look more appropriate for an election year, with more frequent mentions of voting and other activities inherently connected to the election, such as putting up political signs, donating money to campaigns and signing petitions.

However, the greater self-reported activism of liberal Democrats is once again evident, as liberal Democrats far exceed conservative Republicans and other Americans on a half dozen different political activities reported for “last year.” The contrast with the political right is especially stark for having “protested, marched or demonstrated”—30 percent of liberal Democrats report taking part in these activities in the last year, compared with just two percent of conservative Republicans.

Why do reports of greater activism among Liberal Democrats extend to calendar year 2016? The most likely explanation comes from activity during the months of November and December, when news media accounts of greater grassroots activity on the left first appeared, from “Not My President” rallies to “rage donations” made to progressive groups pledging to fight Trump administration policies. Respondent reports for “last year” appear to take these actions into account.
These results mirror a gap in intensity in attitudes measured by SurveyMonkey and other public pollsters in recent weeks. Strong disapproval of President Trump far outpaces strong approval. Intense opposition to Trump’s immigration executive order outpaces strong support, with Democrats far more unified in their opposition than Republicans are in their support. And strong opposition to the Republican health care overhaul eclipses strong support—by more than two to one in some surveys—with opponents saying they are following news about the health care debate far more closely than supporters.
These attitudes help drive political activism. On the eve of a now scuttled U.S. House vote on the Republican health care overhaul bill, North Carolina Republican Walter Jones told a reporter that of the calls from his district about the bill, 4 were in favor and 800 against. The Washington Post compiled reports from 32 Democratic members of Congress in which calls on the bill ran against it by a “nearly 49-to-1 ratio.” To paraphrase the famed political scientist V.O. Key, these expressions of public opinion presumably struck those who chose to pull the bill from consideration as “prudent to heed.”
Methodology: This SurveyMonkey Tracking poll was conducted online March 10-16, 2017 among a national sample of 8,715 adults ages 18 and up. Respondents for this survey were selected from the nearly 3 million people who take surveys on the SurveyMonkey platform each day. Data for this week have been weighted for age, race, sex, education, and geography using the Census Bureau’s American Community Survey to reflect the demographic composition of the United States. Full topline results and detailed demographic breakdowns can be viewed here.


