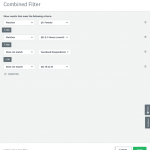
It’s important for you to get actionable data from your survey results. We recently rolled out a new analysis feature that makes it even easier to narrow down results based on how your respondents answered—or didn’t answer—multiple questions. Introducing combined filters, available with Premier plans.
Even if you’re not an expert with survey analysis tools, by combining filters you can create laser-focused reports from your survey data.
When analyzing your survey results, you probably already know that you can create filters to sift through your data. Filters let you see any responses that fit your filter's criteria, while hiding the responses that aren’t relevant. But when you combine these filters, you get the most from your data.
Tips for how to analyze surveys in a snap
Find out how our analyze features can help you come to conclusions in no time.
Set up the filters you need to break down your data
Before combining filters with advanced logic, first you’ll need to create individual filter rules. You can create filters for question and answer, by collector type, time period, custom variables, tags, and more. Then you can create an advanced filter to combine them using AND, OR, and NOT logic. Here’s how the logic works:
- AND - Combine multiple filters and only see the results that fit all the filter rules.
- OR - You can apply more than one filter and see the responses that fit at least one of your filter's criteria.
- NOT - You can select all the criteria in the filter except the one that you want to exclude.
Filtering gets truly powerful when you combine two or more filters with AND, OR, or NOT logic to do more advanced filtering. Here’s how Premier users can use the new feature:
- Go to the Analyze Results section of your survey.
- In the ø Rules section of the left sidebar, click + Filter.
- Click Combine multiple filters.
- In the Combined Filters window, use the drop downs to select a condition and a filter. To use NOT logic, select Does not match.
- Click + Condition and use the dropdowns to add another filter to your combined filter.
- Click the And button to toggle between AND or OR logic.
- In the lower right corner, click Save. Your combined filter will be applied to your results, and show in the ø Rules section of the left sidebar.

Now that you’ve set up your filters, here are some examples of how you can combine filters to get pinpoint accuracy in your data from market research, employee satisfaction, and customer feedback surveys.
Using AND logic for customer feedback
AND logic is a great way to home in on a very specific group of people. Let’s say you’ve sent out a customer satisfaction survey and you want to use it to find out which customers should be offered a promotion or discount. Use AND logic to search for customers that are both new AND to unhappy. You now can target these customers as a way to increase satisfaction.
How could you pair AND logic with NOT and OR logic? Using the same example, you could combine filters to seek out new and unhappy customers, that do not live in California or New York. Then you could work on making customers happy in certain states.
Related content: Get everything you need to know about running a customer feedback program.
Using OR logic to gauge employee satisfaction
When you create filters and apply OR logic, you’re including groups in your analysis to see what traits they share. For example, if you were sending out diversity and inclusion surveys, OR logic could help you home in on which groups of employees need the most attention.
For example, if you’re trying to determine what contributes to high turnover, you can filter for employees that feel unincluded OR those that feel as if their work isn’t valued. Looking at the results from this combined group of people collectively can help you determine how to more forward with improving turnover.
What if you were to combine NOT and OR logic? Using the same example above, you can add a filter by department. The results could show you what employees that feel unincluded or undervalued, but whom are not in the human resources department.
Related content: Learn more about how to measure Diversity and Inclusion for a stronger workplace.
Using NOT logic to understand your market
Basic filtering allows you to sift through your data. But combined filters can help you understand a subset of people in your data. Let’s use the example of launching a market research study on consumer buying habits.
Filtering by demographic could help you look for niche customers, so you could create filters to view specific groups of people, such as women or people under 30. Then, you can create additional filters to include buying habits, such as where respondents shop. These filters yield a number of results like the types of stores consumers shop at: grocery stores, department stores, online stores, and more.
After creating these filters, you could then use NOT logic to look for respondents that match a certain criteria but do not shop at a particular type of store. For example, learning about women under 30 that do not shop at department stores may tell you that this subset of people are more likely to buy your product.
Related content: Not sure where to start started on market research projects? Check out 5 examples of DIY market research.
If you’ve collected your survey results, now it’s time to dig in, start sorting, and analyze the data. For more analysis features that help you get the most from your data, check out our plans and pricing.


