To celebrate the launch of the SurveyMonkey Technology Ecosystem Program (STEP), we’re highlighting one company that we’ve partnered with—in one way or another—every day in August. This is a guest post by Alyona Medelyan, CEO of Thematic. Check out all our integrations partners here.
If you ever left customer feedback yourself, you will know that your star rating or a satisfaction score can give you a really good idea of what’s going on, but not much detail about why.
SurveyMonkey enables you to ask for more detailed answers with open-ended questions, but the sad truth is that while most businesses collect feedback, they do not analyze text comments. It’s just too hard to read all those answers and make sense of them.
In this blog post, we’ll break down the task of analyzing open-ended customer feedback. How can you draw insights from the text feedback of your customers that drive meaningful change for your company, without losing hours of your life to it? We’ll explain this AND share a spreadsheet template you can use today to analyze your feedback.
So read on!
Why analyzing customer feedback is difficult
If you ever tried to put together a summary of what multiple people want based on their feedback, you’ll know that it’s a difficult task.
Read 50 to 100 pieces of feedback, and it already feels like Big Data!
You can write a very generic summary fairly quickly. But creating a detailed actionable report that will be trusted by others is a job of many days, if not weeks.
There are two key reasons why this task takes a long time:
- Our language is complex: People use many different words and phrases to describe the same thing.
- Quality of feedback varies: Feedback might be very specific and actionable, or very generic and not helpful.
But ultimately, it comes down to the lack of good tools that can deal with these difficulties. You’ll want a perfect mix of automation and ease of use.
Let’s review how one should think about analyzing open-ended feedback, whether manually or automatically. And then, we’ll dig into the tools.
How to ensure accurate analysis and why it's important for taking the right actions
Because analyzing feedback is difficult, people resort to workarounds such as reading samples or creating word clouds. This works if you’re looking for a very high-level overview of trends (SurveyMonkey even creates word clouds for you automatically), but not if you want to get a real, clear idea of what individuals think.
The results are either incomplete, biased towards the sample and the person reading it, or lack nuance and actionability.
Here is how you can ensure that your analysis is accurate and actionable.
- Use inductive coding: Instead of using a predefined set of themes you’d like to find in feedback, you iteratively discover themes as you read the feedback. In our qualitative coding blog post, we describe how to do this methodically.
- Don’t just put comments into buckets: Each person will have multiple themes in their feedback, and each one might have a specific sentiment. Make sure your themes cover each piece of feedback well.
- Use a hierarchy of themes: You might start with some generic themes like “pricing”, “usability issues”, but then break them down into more specific themes, since they will be more actionable, e.g. “in-app chat doesn’t work” is very specific and actionable. If several people mentioned this issue, many more are likely to have it, and it’s worth addressing. A hierarchy will help navigate the themes when reviewing feedback.
- Ensure a good balance of themes: You don’t want to end up with a long-tail of themes, keep the top level of your hierarchy under 20.
- Make accuracy a priority: If you are analyzing feedback manually, get a colleague to verify the accuracy of your sample. If you are automating the analysis, you can eyeball a sample of data or compare the top themes picked up automatically vs. manually for a sample. You may find our quick guide on measuring feedback analysis accuracy helpful.
If your feedback analysis isn’t comprehensive, others might question your findings as personal opinions, they won’t treat your insights as data and as a result, won’t act on your findings.
If your feedback analysis isn’t accurate, the company might make the wrong decisions, focusing on the wrong things and as a result lose customers or miss opportunities for growth.
How to analyze feedback
Before analyzing feedback, make sure you have gathered all feedback in one place.
How to collate feedback in one place
First think: Where is your customer feedback? Here are some possible sources:
- Surveys, e.g. CSAT or NPS
- Online reviews
- CRM notes
- Chat interactions
- Call center notes
For some of these, you’ll know who was the customer who left the feedback, for others you might not. Capture as much data as possible and link it to each piece of feedback. Use spreadsheets, a database or a third-party tool.
But remember, context matters. For example, if a survey question was “What can we improve?”, the response “Pricing” will mean “issues with pricing”, but it can mean the opposite for a 5-star review. Collate with care.
How to analyze feedback manually
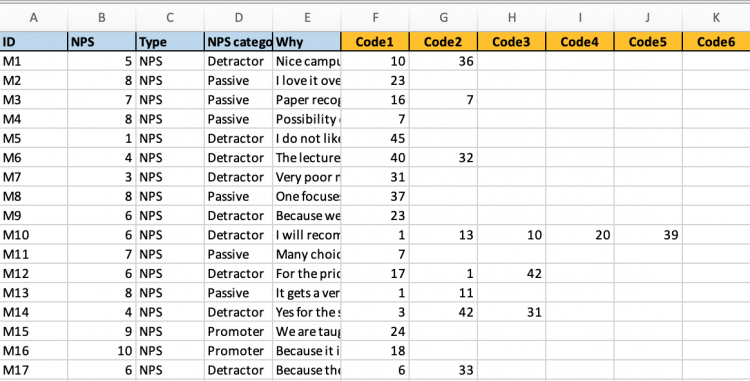
You’ll need two spreadsheets. One for keeping your code frame of themes and subthemes, and another for coding each piece of feedback according to that code frame. Use two screens for efficiency.
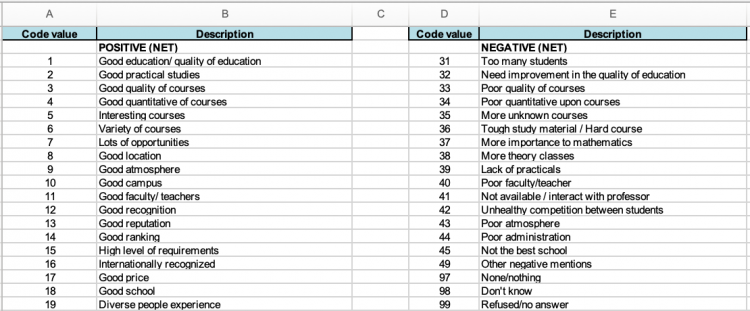
In this example, a 2-level hierarchy that’s based on sentiment, rather than themes. It gives an idea on how to structure both spreadsheets:
- Code frame that separates positive and negative themes.
- Coding each piece of feedback (column E) according to several codes from the code frame.
Another method for manual coding of feedback is described in the article by Intercom. They suggest to use Feedback Type as one of the hierarchy levels, e.g. usability issue, bug, new feature request.
How to automate feedback analysis using a script
You can automate feedback analysis using either a third-party solution (more about this later) or a DIY script. We’ve tested different DIY methods (text categorization libraries, topic modelling, NLP APIs) and found that the most effective method is keyword extraction, because it discovers meaningful keywords in your data.
You can adopt an existing keyword extraction script such as Kea or Rake to your needs. Here is a tutorial on this topic to help you get started.
On our test dataset, the phrases that this approach returned looked significantly more useful, compared to other DIY solutions:
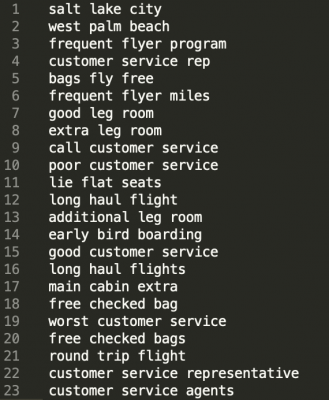
One issue is that these are key phrases and not themes. Ideally, you want to merge and organize them further. You would need to expand the script to do this, which requires some help from an expert.
How to automate feedback analysis using third-party solutions
Of course, there are specialized solutions for automating feedback analysis. Some are more DIY than others.
This includes text analytics solutions (although not all of these are specific to feedback), qualitative data analysis solutions, or Voice of Customer platforms.
For example, a solution like Nvivo has both manual and automated methods for coding feedback. It’s targeted at researchers. A solution like Clarabridge has specific industry taxonomies for different industries and is targeted at enterprises.
Full disclosure, I’m biased here, but Thematic sits in the perfect middle. Built specifically for customer feedback analysis it’s made for teams at data-driven companies. We also happen to be the only one with an integration with SurveyMonkey.
Thematic’s AI discovers themes (not just keywords) bottom up in your feedback and then you can edit them easily:
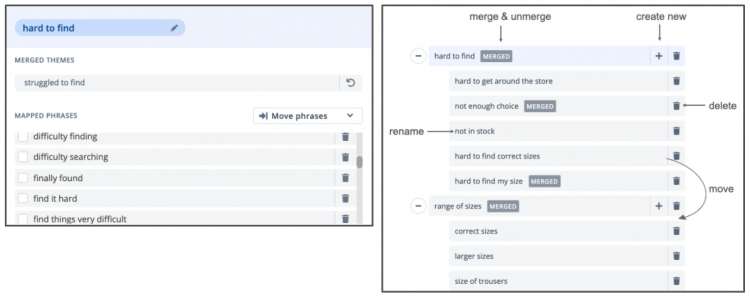
Thematic ensures consistency of themes over time, but at any point you can change them and re-analyze the data to suit your team’s purposes. It helps unify data regardless of feedback channel. And the final benefit is that Thematic visualizes your feedback in a way that answers key business questions, which brings us to our next point:
How to present the results to drive actions
In order to drive results based on insights from qualitative feedback, you need to treat it like any other hard data. Luckily, if you’ve followed the instructions above, your themes can be visualized like numbers.
Here is how we visualize feedback at Thematic:
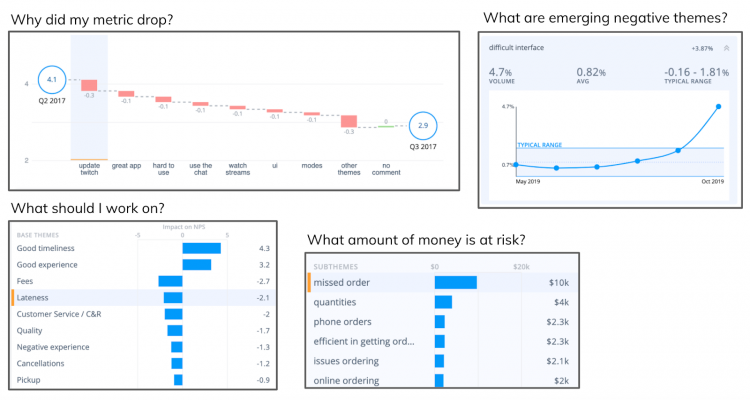
As you can see, every visualization is purposefully designed to answer specific questions.
If you opt for a DIY solution, you’ll find most of these charts in Excel: a bar chart, a line chart, and yes, even a waterfall chart. You can and should analyze feedback consistently and accurately, and visualize it meaningfully!
In fact, to make things super simple for you, we’ve built a DIY spreadsheet template for a typical NPS survey. You can use it to implement the whole process (manual or semi-automated) of feedback analysis and visualizing the results.
And if you want to use Thematic on your SurveyMonkey data, there is a free version (and a full trial) here.
No excuses now!


