2020 research report: How to adapt and thrive in times of crisis
New insights on how agility and curiosity are helping organizations weather the storm of 2020

2020 has marked the greatest period of uncertainty and economic volatility our generation has ever faced.
Yet some organizations have quickly adapted to the shifting forces that have short circuited the economy, and are surviving—even thriving—during the crisis by using:

Curiosity
To uncover and pressure test the solutions that can help them find success.

Agility
To act with enough speed and commitment to uncertainty and adapt to volatility.

This report gives you access to the insights gained from more than 3,275 respondents across industries, as well as case studies of organizations navigating the crisis, to understand how successful organizations are running their shops in a crisis, formulating their strategies, treating their employees, and more.
The pandemic threatens our health, our lives—and our livelihoods
2 in 5 people say they had their income reduced or hours cut

Just 39% of workers think their company is prepared to withstand an economic downturn

For people of color, the stakes have become even higher
Asian, Hispanic, and particularly Black people are much more likely to say they’ve lost their job during the crisis.*

Black women are nearly 2x as likely as white men to say they were laid off, furloughed, or had hours or pay cut due to the pandemic.*

*Findings from a SurveyMonkey poll conducted with Lean In on April 1-3 2020 among a total sample of 2,986 adults ages 18 and over living in the United States.
Times have never seemed more bleak for many of our customers, constituents, colleagues, and employees.
Historians, economists, and journalists will look back on the actions taken to address the myriad challenges of 2020 and remember those who acted swiftly and wisely in the face of adversity. In this historic moment, we all need leaders and business partners who can meet the challenges of this new world order, find novel ways of operating, and ultimately help drive the resolution of this crisis.
How organizations are weathering the crisis
Amid intense uncertainty, businesses are pivoting, downsizing, and staying curious by asking questions
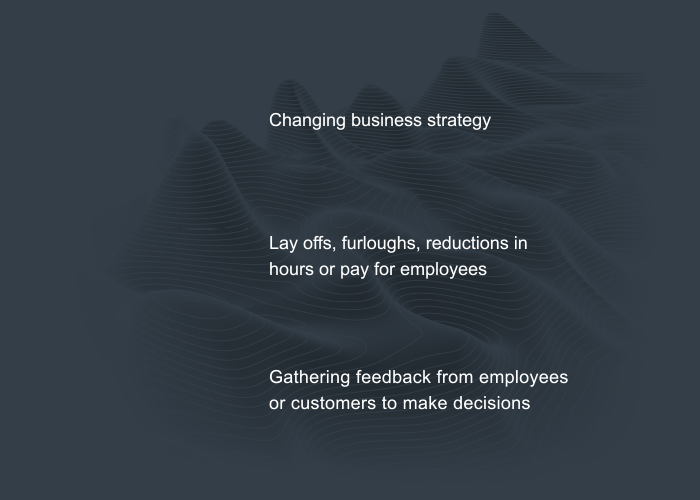
The top 3 cited ways businesses are responding to the coronavirus crisis:
The most successful companies are finding opportunity in the chaos
The top 3 cited ways businesses are responding to the coronavirus crisis, among those who say their company is prepared for a downturn:

Our research shows that those with the best outlook for weathering the crisis aren’t just lucky. They share two fundamental traits that makes them especially suited to adapt, survive—and even thrive.

Curiosity
The willingness to explore, seeking new opportunities and solutions by using data and feedback as a guide.

Agility
The ability and resolve to act quickly to adapt to new paradigms by fundamentally changing the established order.
Agile organizations that are adapting to weather coronavirus
TripActions
Few industries have been hit as hard as the travel industry, yet TripActions, the makers of business travel management software, has added more than 270 customers since the crisis began by fundamentally changing how they do business and market their products.
GM
Ventilators, crucial for keeping critically ill coronavirus patients alive, are in short supply. While an automaker may not be the first company you’d expect to address the shortage, GM is producing thousands by pairing its massive production capacity with the know-how of small medtech company Ventec.
The State of Rhode Island
The smallest state in the country is dense, with an older population, and is nextdoor to New York, the early epicenter of the US coronavirus epidemic. Nevertheless, Gov. Gina Raimondo has developed an effective strategy for using technology to track and contain the outbreak in her state.
The town of Breckenridge
When local businesses in Breckenridge, Colorado, felt the impact of a dramatic drop in tourism, the town quickly moved to support them with $1 million in grants. When every second counted, the city swiftly processed applications and distributed funds to keep small businesses afloat.
Discover more resources

Solutions for your role
SurveyMonkey can help you do your job better. Discover how to make a bigger impact with winning strategies, products, experiences, and more.

Product feedback surveys
Our product feedback surveys give you the insider knowledge you need to plan new products, grow your business and succeed in today's competitive marketplace. Here are a few ideas on how you can send product surveys, get feedback and develop successful marketing strategies. Get started now.

Why are surveys important in research?
Surveys are important in research because they offer a flexible and dependable method of gathering crucial data. Learn more today.

Ad testing: Why it matters and how to successfully perform it
Learn the best practices for performing an ad test—from brainstorming your questions to analyzing your results—so you can confidently land on the best option.
Find out how organizations use agility and curiosity to find success in the coronavirus crisis
The most agile, curious organizations have happier customers, stronger bottom lines, and employees who are more confident that their company will weather the pandemic. Read more about why these companies are coming out ahead in the pandemic.
Editor's note: Data on this page based on initial research with 3,275 respondents. Subsequent research included a total of 3,917 respondents which changed overall percentages listed by <3% or not at all. All percentages listed in the downloadable guide are based on final percentages from 3,917 respondents. Respondents for this survey were selected from the more than 2 million people who take surveys on the SurveyMonkey platform each day. Data were weighted for age, race, sex, education, and geography using the Census Bureau’s American Community Survey to reflect the demographic composition of the United States.