Market research: What it is, how to do it, and examples
Learn how to do market research to enter new markets, satisfy customers, and launch new products.
Market research gives businesses a comprehensive, data-driven insight into customers, trends, and competitors. By conducting market research, businesses can obtain the precise data they need to enter new markets, satisfy their customers, and confidently launch new products.
This is especially critical given that more than 70% of all newly launched products for daily life fail after their introduction. Early market research reduces this risk significantly and maximizes success by aligning your business strategy with customer needs.
Successful business operations start with effective market research.
What is market research?
Market research is the process of collecting, analyzing, and interpreting information about a target market, customers, competitors, and the overall industry environment to guide better business decisions. It helps organizations understand what drives consumer behavior, how preferences change over time, and which market opportunities hold the greatest potential for growth.
Behind every market research process are professionals who analyze data, interpret consumer behavior, and uncover insights that help organizations make informed decisions about growth and strategy.
A strong market research program goes beyond data collection because it transforms raw information into actionable insights. Organizations apply these insights to shape product development, refine messaging, improve customer experience, and build evidence-based marketing strategies.
Types of market research
It’s remiss to mistake market research as a monolith. In fact, market research is a broad term encompassing several types of research, so you can gain a multitude of data and supporting evidence to confidently make business decisions.
- Primary research, or firsthand study, occurs when you collect original data that answers a specific research question.
- Secondary research occurs when you analyze existing data that others have published to answer your question.
Understanding both types of market research, research methods, and their respective use cases can help you create a market research design that effectively addresses your business question.
Primary research
Primary research is useful when a business is unlikely to find public data on its research question. This is especially true when a business is evaluating its own products and services.
The following are a few methods market researchers employ:
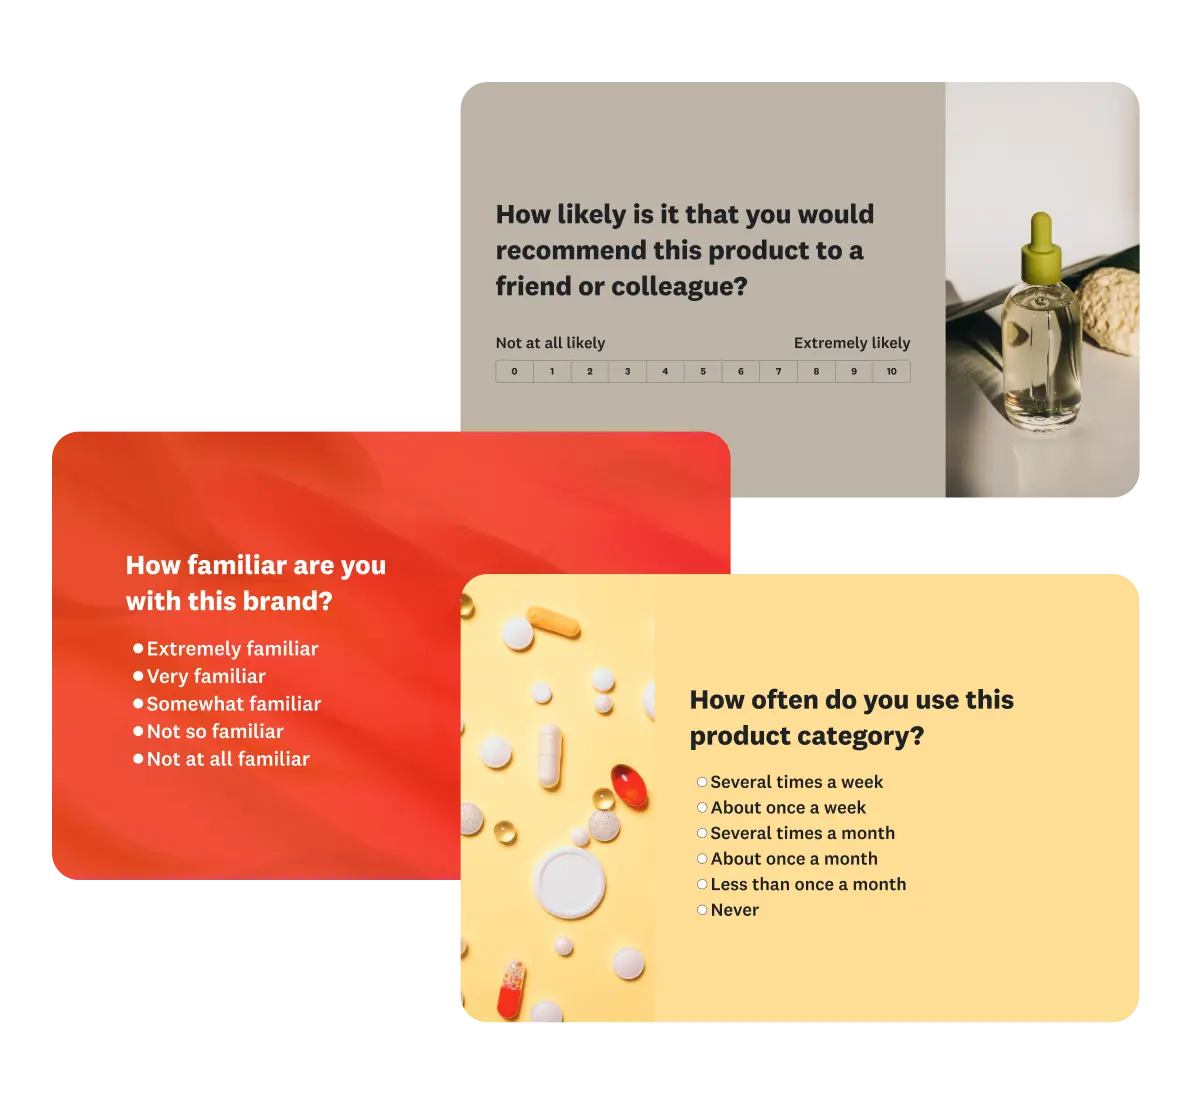
- Surveys are a quantitative method of collecting information from a large pool of respondents by asking standardized questions. They help businesses understand customer preferences, purchasing behavior, satisfaction levels, and market demand. Surveys can also collect some qualitative data in the form of open-ended questions.
- Interviews are one-on-one conversations that provide insights into individual customer motivations, perceptions, and decision-making processes. In-depth interviews allow for deeper exploration of complex topics that may not surface in group settings.
- Focus groups are guided discussions with a small group of target customers that reveal collective attitudes, opinions, and reactions to business ideas, products, services, or marketing strategies.
- Online market research, such as web analytics, social media listening, and market research surveys, collects real-time data on customer behavior, market trends, and competitive positioning.
- Product testing allows potential customers to use a product under controlled or real-world conditions. Product testing helps identify usability issues, gauge customer satisfaction, and fine-tune offerings before full-scale launch.
Secondary research
Businesses find secondary market research useful when they aim to conduct high-level research on a topic that has already undergone investigation. Wider research questions typically already have published answers.
Secondary market research methods include:
- Industry reports are produced by research firms, trade associations, or consultancies. Reports provide detailed insights into market size, growth trends, key players, and future outlooks. These reports enable businesses to benchmark their performance, identify emerging opportunities, and make informed strategic decisions.
- Competitor analysis is a systematic assessment of direct and indirect competitors to understand their strengths and weaknesses. This analysis enables businesses to uncover market gaps, differentiate more effectively, and anticipate competitive moves.
- Government publications include economic indicators, demographic statistics, trade data, and regulatory information. These publications offer reliable, often free, resources to validate market assumptions and ensure compliance with legal and industry standards.
How to do market research: A step-by-step guide
Market research is a nuanced process that requires foresight and some advanced planning. Mapping the research will equip you to successfully launch an initiative, gather insights, and convert data into actionable steps for enhancing your organization.
Here are the steps you should follow when conducting market research.
Step 1: Set research objectives
The research question and subsequent objective focus your research and define everything, from data collection to analysis method.
The business question is a concise summary of the problem you’re solving and the context in which it fits within your business. They are high-level goals or challenges that tie directly to business objectives. For example, “Why are sales declining?”
The research goal outlines the specific facts or metrics you hope to learn through your research. For example, a research goal might be to measure brand awareness to understand its impact on sales.
Writing strong, relevant research goals is important because they will translate to specific survey questions later. Here are some hypothetical business questions and research goals.
| Business question | Research goal |
| Consumer behavior: We’re considering investing in a couple of video streaming service companies, and we need to understand the existing landscape and perceptions so that we can invest wisely. | Learn what tech brands and apps are most popular among millennials. Gather proof points around the quantity and satisfaction of apps used. Understand millennials’ usage and attitudes towards streaming services. |
| Ad testing: We’re nearing market launch with our new dog food, and our designers have developed several compelling designs for print ads. How do we decide which design to choose? | Compare consumer appeal and preference for each ad design. Identify which design consumers would be willing to pay more for. Assess any differences by consumer demographics. |
| Brand tracking: We’re an established brand in the sparkling water category, but numerous new brands have launched in the last year. What does that mean for us? | Measure brand awareness for all major brands in the category. Assess each brand’s perception and associations. Understand brand adoption for our brand and the new entrants. |
Step 2: Identify your target audience
Identifying your target audience before conducting market research ensures that you gather relevant and accurate data, tailor your approach, optimize resources, and develop effective strategies.
To achieve this, you need to understand your target audience, including their demographics, employment status, firmographics, shopping habits, and behavioral attributes.
In addition to identifying your target audience, you may also want to identify the scope. Sometimes you want to target a broad audience to conduct exploratory research for potential markets. At other times, you may want to target a narrower group of people to understand their consumer preferences.
These goals also impact how you reach your target audience. Two solid options include:
- Leveraging existing contacts like your customers, website visitors, newsletter subscribers, and social followers. Common ways of surveying existing contacts include via email, by posting on social media, embedding the marketing survey on your website, or adding a web link or QR code on a receipt.
- Choosing from pre-profiled targeting options using tools like SurveyMonkey Audience provides businesses with access to an audience of over 335 million people, offering advanced targeting options.
Step 3: Choose your research method
Selecting your research method is crucial in designing and launching a market research effort. The type of research you choose—qualitative, quantitative, or a mix—directly influences the depth, reliability, and applicability of your results, making this decision vital to your project’s success.
The right method depends on your research objectives.
- Qualitative methods, such as interviews or focus groups, may be most effective if you're seeking to explore existing customer motivations or perceptions.
- Quantitative tools, such as surveys and online analytics, provide structured, statistically meaningful data when aiming to measure behaviors, preferences, or trends at scale.
- Secondary data analysis can also play a role depending on your resources and desired insights.
While one or two primary methods will often best align with your goals, it's important to remember that research isn't always a one-size-fits-all approach.
Combining multiple methods—such as following up a survey with in-depth interviews—can provide a more nuanced and well-rounded view of your market. Each method offers distinct strengths, and using them together allows you to validate findings, uncover actionable insights, and build a stronger, evidence-based strategy.
Step 4: Analyze data
Market research does not stop at data collection. Data analysis involves systematically examining and interpreting data to uncover patterns, trends, and insights that inform decision-making.
Start with clean, complete data
Before analyzing the results, ensure your dataset is clean—remove low-quality responses and wait for all responses to come in to avoid skewed results (e.g., due to time zone or demographic differences). Ensure that your sample accurately represents your target population. If it doesn’t, apply survey weights to your results to correct imbalances.
Check for statistical significance
When comparing results—across demographic groups or survey waves—ensure differences are statistically significant before drawing conclusions.
Statistical significance indicates whether one group's answers differ substantially from those of another group through statistical testing. When a difference between sample groups is statistically significant, you can be confident your results represent a real population characteristic instead of random variation in your sample.
A practical rule of thumb is to check whether the confidence intervals for two estimates overlap. If the confidence intervals do not overlap, it’s likely a statistically significant change.
The confidence interval is calculated by adding and subtracting the margin of error from an estimate. You can check your margin of error using a margin of error calculator or use the table below as a guide. As a general rule, the margin of error gets smaller as the sample gets bigger.
| Sample size | Margin of error (at 95% confidence level) |
| 50 | +/- 14% |
| 100 | +/- 10% |
| 150 | +/- 8% |
| 250 | +/- 6% |
| 400 | +/- 5% |
| 600 | +/- 4% |
| 1,100 | +/- 3% |
| 2,500 | +/- 2% |
For example, say you survey 400 people and estimate that awareness among men is 45% and awareness among women is 60%. Given a margin of error of ±5 percentage points, the confidence interval for men is 40% to 50% and the confidence interval for women is 55% to 65%. Because those confidence intervals do not overlap, the difference is likely statistically significant.
Track trends over time
Running surveys over time—monthly, quarterly, or on an ongoing basis—helps you benchmark and monitor shifts in customer behavior, brand perception, and market dynamics. Just be sure to keep targeting criteria and methodology consistent across waves. Only the timing should change.
Analyzing trends over time, combined with statistical rigor, gives you reliable insights that drive smarter, evidence-based decisions.
Step 5: Interpret your findings
When you get your market research results, you’ll look at aggregated answers for the entire sample you collected. Looking at how individual segments of your population respond to your market research is one way to uncover insights that could be critical to your analysis.
Here are a few market segments of your sample you could look into:
- Demographic segments: Gender, age groups, etc.
- Geographic segments: Countries, regions, states, etc.
- Behavioral segments: Frequent category purchasers, discount buyers, etc.
Further, there are two key ways to segment your results for deeper insights:
- Filter your results to see how specific segments responded.
- Make comparisons across segments or against the overall data to uncover meaningful differences.
For example, in a sparkling water brand awareness survey, women consistently showed higher brand awareness than men. This gender gap was especially pronounced for brands like La Croix and Bubly, while brands like Schweppes showed smaller differences.
When segmenting your data, always consider the resulting base sizes. For example, if your total sample is 300 respondents, breaking it down by US state may leave only a few responses per state, insufficient for drawing meaningful or reliable conclusions.
Step 6: Report your findings
Finding a clear, logical story within your data is the most effective way to make a lasting impression and capture the attention of your stakeholders.
You should set up the story to ensure stakeholders understand the context before you present your findings and recommendations. Storytelling frameworks, like SCQA, can help you develop an outline for your presentation.
SCQA stands for Situation, Complication, Question, and Answer.
- Situation: Current business context and known facts.
- Complication: The core problem driving the need for research.
- Question: The specific research questions and your approach to answering them.
- Answer: Key insights that address the business questions and guide action.

In addition to the story, numerical data supports your business case, giving stakeholders tangible data to hold onto.
The powerful stats are the ones that support your claim with large numbers. This is because once you exceed the 50%-mark, you’re talking about the majority.
If the data that supports your story isn’t a captivating statistic, try reframing it.
Instead of “10% of Americans would feel safe as a passenger in a self-driving car”, try “90% of Americans would not feel safe.” Note that in cases where you’re conducting a structured analysis (e.g., building a scorecard), reframing stats won’t work.
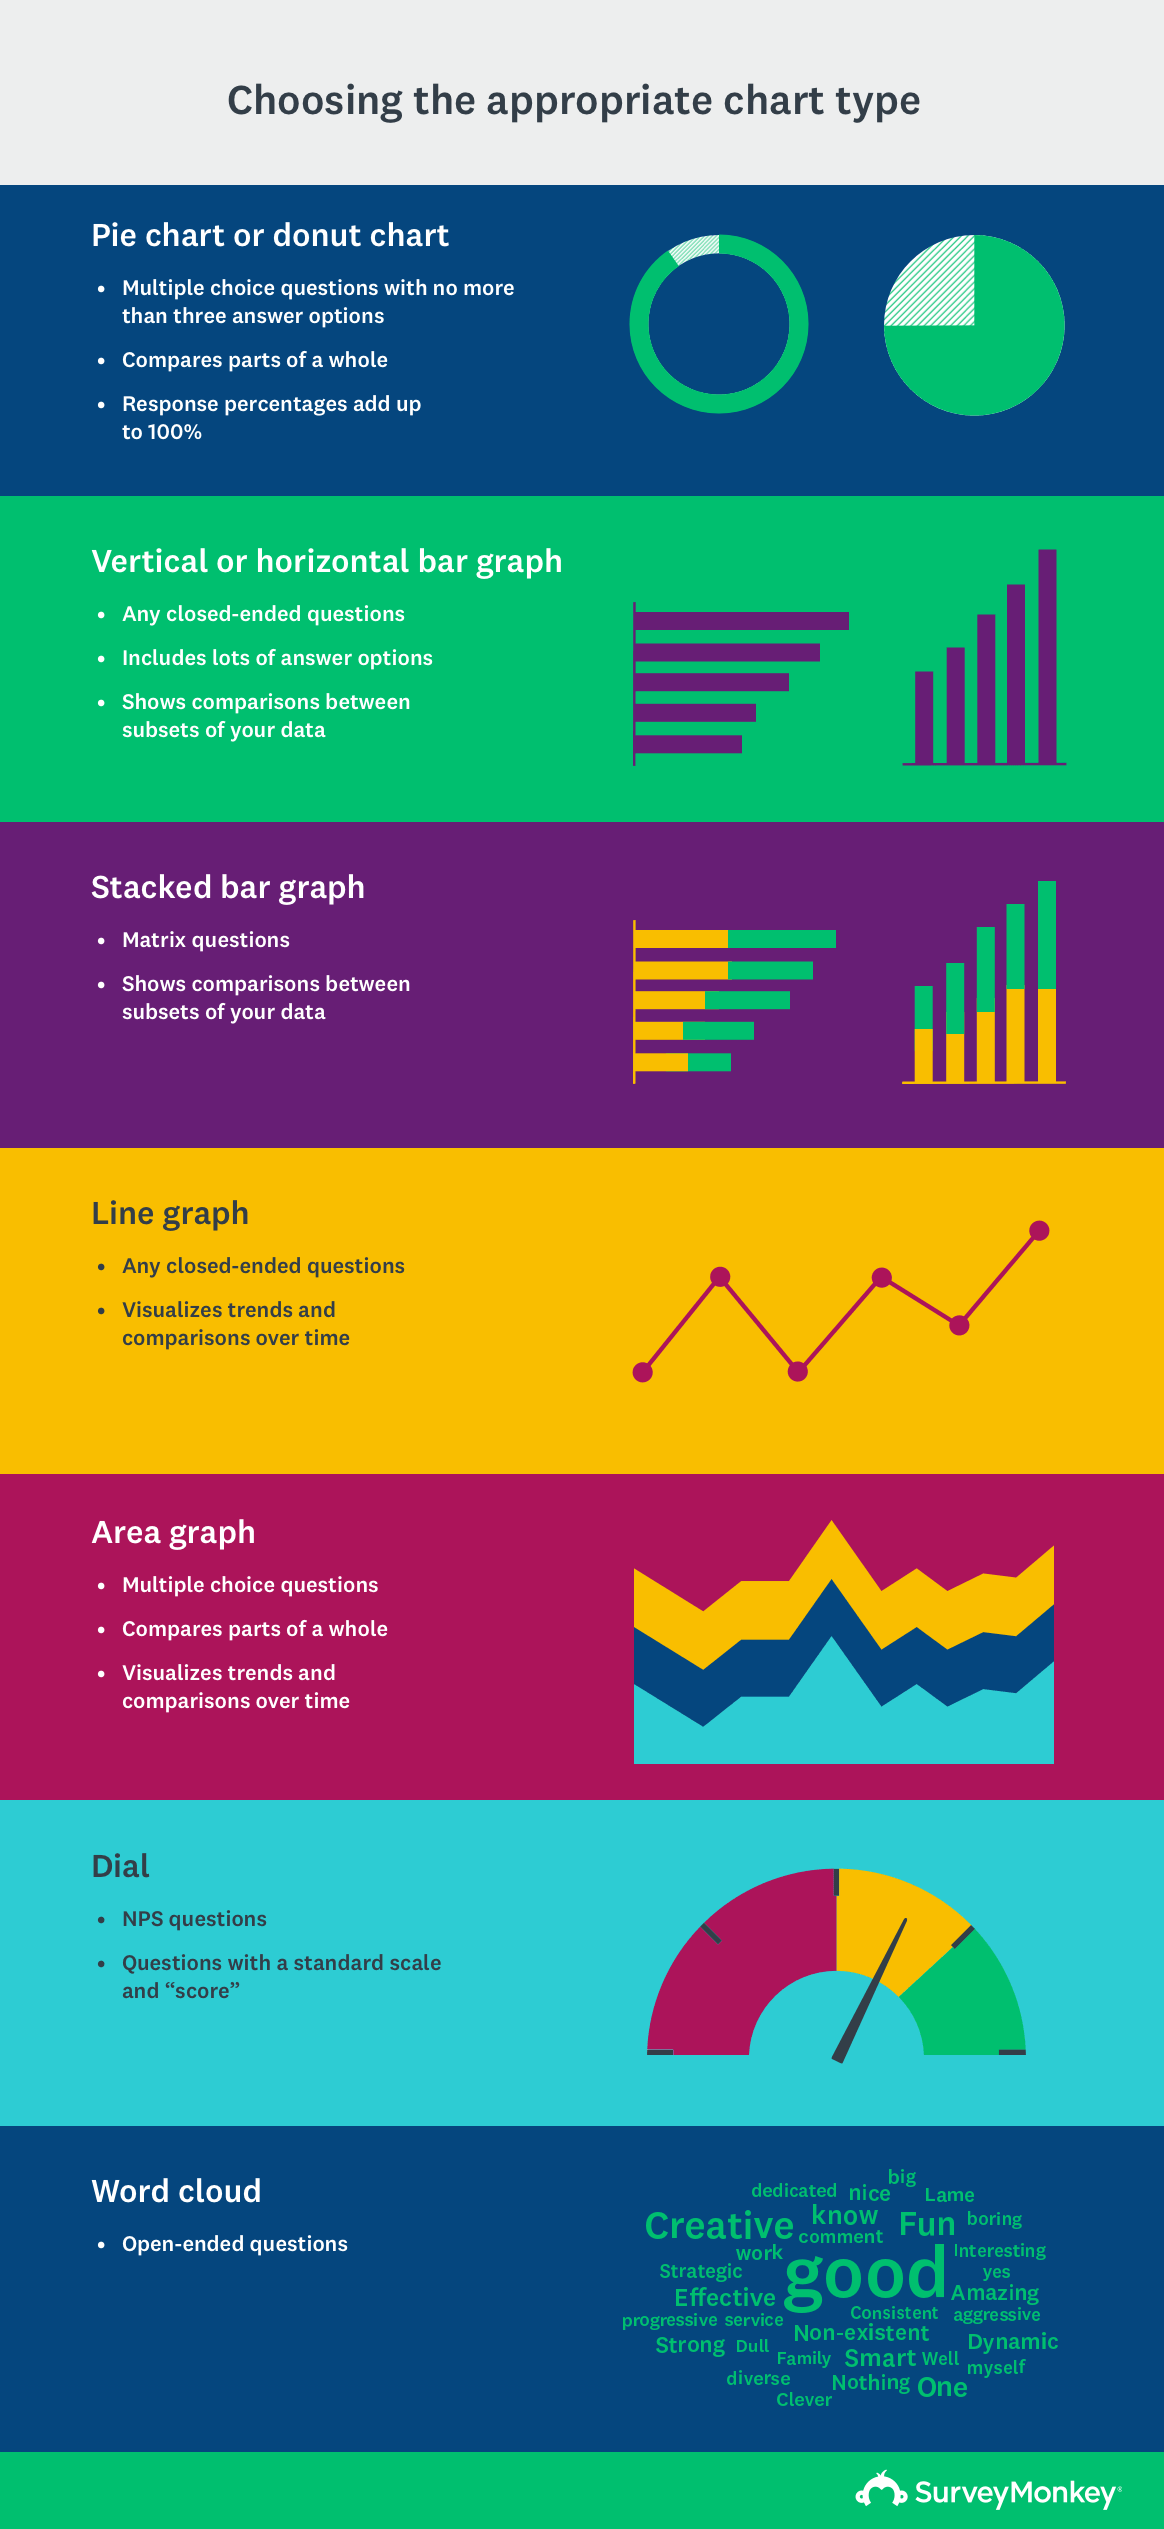
To further support claims, you may also visualize your data.
SurveyMonkey research suggests that 42% of people find data visualized with charts, graphs, or infographics more enjoyable than data presented in a sentence or a table.
Here are the most common chart types and when to use them:
Step 7: Take action
After collecting data, crunching the numbers, and drawing up an actionable plan, you’re ready to present your findings to stakeholders. Gaining buy-in for your recommendations and motivating others to take action can be a challenge.
To win over your stakeholders, you must make your recommendations realistic and aligned with the overall business strategy. You may adapt your business recommendations to the SMART framework.
- Specific: Stakeholders are less likely to implement vague recommendations. Ensure that your recommendations outline specific, actionable steps.
- Measurable: Tie your recommendations to quantifiable business outcomes, or better yet, forecast the business impact of implementing your recommendations. Including metrics in your recommendations, even if based on assumptions, will help you sway your leadership team.
- Attainable: If your recommendations are unrealistic, you’ll lose your audience. If they are aggressive or require more resources than are available, outline what it would take to accomplish your recommendations.
- Relevant: Start by referring back to your research brief. Ensure that your recommendations are grounded in the initial business question and supported by your insights. Also, keep your recommendations focused on the audience you’re presenting to (e.g., marketing recommendations to the marketing team).
- Time-bound: Anchor your recommendations to a clear timeline. Specify when actions should begin, key milestones, and expected completion dates. A defined timeframe creates urgency, facilitates accountability, and enables stakeholders to plan and prioritize implementation effectively.
Market research example
Across the board, market research can help your business push toward a data-driven future. A great example of this in action is Sakura of America.
Sakura utilized SurveyMonkey market research solutions to conduct an investigation into how the North American market approaches product development and design. Based in Japan, the majority of Sakura’s original research focused on the Japanese market.
SurveyMonkey provided a detailed insight into the target market, revealing valuable information about market size, competitive landscape, product positioning, and direct feedback from SurveyMonkey customers.
Sakura identified new research and development initiatives with the potential to succeed in the North American market.
Build effective market research surveys with SurveyMonkey
Market research eliminates the guesswork. Everyone, from customer experience executives to marketers, can use market research to make confident, data-backed decisions that get the business where it needs to be.
You don’t need to be a market researcher with SurveyMonkey. SurveyMonkey offers extensive support and fully managed market research initiatives, including market research survey templates. Whether you’re sending consumer behavior surveys, testing a business naming convention, or accessing SurveyMonkey Audience, our global survey panel, we have a solution for you.
Ready to get started?
Discover more resources

Solutions for your role
SurveyMonkey can help you do your job better. Discover how to make a bigger impact with winning strategies, products, experiences, and more.

Product feedback surveys
Our product feedback surveys give you the insider knowledge you need to plan new products, grow your business and succeed in today's competitive marketplace. Here are a few ideas on how you can send product surveys, get feedback and develop successful marketing strategies. Get started now.

Why are surveys important in research?
Surveys are important in research because they offer a flexible and dependable method of gathering crucial data. Learn more today.

Ad testing: Why it matters and how to successfully perform it
Learn the best practices for performing an ad test—from brainstorming your questions to analyzing your results—so you can confidently land on the best option.