How to select a random sample in Excel
Select a random sample in Excel for unbiased data analysis.
When you have 10,000 contacts but only have resources to reach 500, random selection in Excel is your best tool to ensure your subset is representative of the whole group. By letting probability pick your participants, you eliminate personal bias and ensure your results aren't skewed toward a specific demographic or behavior.
This guide walks through quick Excel setups that use a few formulas and the same good habits survey teams rely on when they choose who to invite, plus how to select a random sample in Excel without extra manual work.
What is random sampling in Excel?
Random sampling in Excel is a way to select a subset of rows using Excel functions so every record has an equal chance of being chosen. It applies the same principles as probability sampling to create an unbiased group you can analyze or contact.
Excel handles this by shuffling your full list, returning the exact number of rows you need, and letting you lock the final output so it won’t change when formulas recalculate. This keeps your sample fair, stable, and aligned with the way survey teams build representative samples.
Why random sampling matters
Random sampling matters because it’s what allows a small group in Excel to represent your full population fairly. It’s the same principle behind probability sampling: every row in your spreadsheet has the same chance of being selected, which keeps your follow-up survey or analysis aligned with the broader group you care about.
In survey terms:
- The population is the full group you want to understand (for example, every customer).
- The sampling frame is the list of people you can contact.
- The sample is the group that responds.
A simple random sample outperforms convenience picks because it avoids patterns that sneak in when you choose based on what’s easiest, like the last 20 orders or the first names alphabetically. Those shortcuts can overrepresent certain people (new customers, early respondents, a specific segment) and skew the findings.
Random selection helps minimize bias so your final dataset is more likely to accurately reflect the diversity of opinions, demographics, and behaviors in the population.
You’re doing this to get trustworthy results, not just a shuffled list. With the basics in place, the next step is seeing how Excel turns those principles into a clean, unbiased sample.
Modern Excel vs. legacy Excel
To keep things simple, the guide splits into two paths: newer versions and older versions of Excel. Both paths get you to the same place—a clean, fair list of contacts—so you can choose the Excel path that matches your version.
- Lane A: Modern Excel (Microsoft 365 / Excel 2021+)
Use dynamic arrays such as RANDARRAY, SORTBY, and TAKE for how to select a random sample in Excel without helper columns. This lane returns an exact number of rows in one step and is easiest to maintain over time. - Lane B: Legacy Excel (Excel 2019 and earlier)
Use a helper RAND() column, sort by that column, and then take the top n rows. This lane has been in use for years and works across older workbooks that don’t support dynamic arrays.
You can easily export survey responses to Excel with SurveyMonkey Connect, pick the lane that matches your version of Excel, and apply the steps to that exported list.
Use Connect to select your random sample
Transfer your survey data to Excel using Connect—no data science credentials required.
How to select a random sample in Excel 2021+
Modern Excel versions make random selection in Excel much simpler. Dynamic arrays use one formula to shuffle your list and return an exact number of rows without helper columns or manual resorting. This is the main random sampling pattern in Excel when you want a random selection from a list that’s easy to reuse.
You’ll combine three functions:
- RANDARRAY to generate one random number per row
- SORTBY to shuffle the rows using those numbers
- TAKE to pull out exactly n rows for your sample
Example: Sample 500 rows from a table
If your contact table runs from A2:D10000 and you want a random sample of 500 rows, the formula would be:
=TAKE(SORTBY(A2:D10000, RANDARRAY(ROWS(A2:D10000))), 500)
How it works:
- ROWS(A2:D10000) counts how many rows are in your frame.
- RANDARRAY(ROWS(A2:D10000)) creates one random value per row.
- SORTBY(A2:D10000, ...) shuffles the table using those random values.
- TAKE(..., 500) returns the first 500 rows from the shuffled output.
This is a straightforward pattern for how to select a random sample in Excel when you want to keep multiple columns together.
Example: Sample only one column (like emails)
If you only need a single field, such as email addresses in A2:A10000, you can use the same structure on that column:
=TAKE(SORTBY(A2:A10000, RANDARRAY(ROWS(A2:A10000))), 500)
The logic is the same: RANDARRAY generates random numbers, SORTBY shuffles the list, and TAKE returns the top 500 records. This covers how to randomly select from a list in Excel when that list is just one column.
Save a fixed copy so the sample doesn’t change
Dynamic arrays are volatile, which means RANDARRAY recalculates every time Excel recalculates. A formula edit or refresh somewhere else in the workbook can silently reshuffle your random sample.
Once the sample looks right:
- Select the spilled results from your TAKE formula.
- Copy the range.
- Use Paste values into a new sheet or table.
That turns the output into a fixed list, so your sample won’t change the next time Excel recalculates. It’s the last step for a clean Excel random selection from a list that you can use for outreach.
If your contacts came from SurveyMonkey Connect, this method means you’re sampling actual respondents, not just spreadsheet rows, which keeps the Excel step aligned with how the survey data was collected.
How to select a random sample in Excel 2019
Older Excel versions handle random selection with a helper column instead of dynamic arrays. This lane is a simple way to do random sampling in Excel when you don’t have RANDARRAY or SORTBY, and it still gives you a fair shuffle of rows.
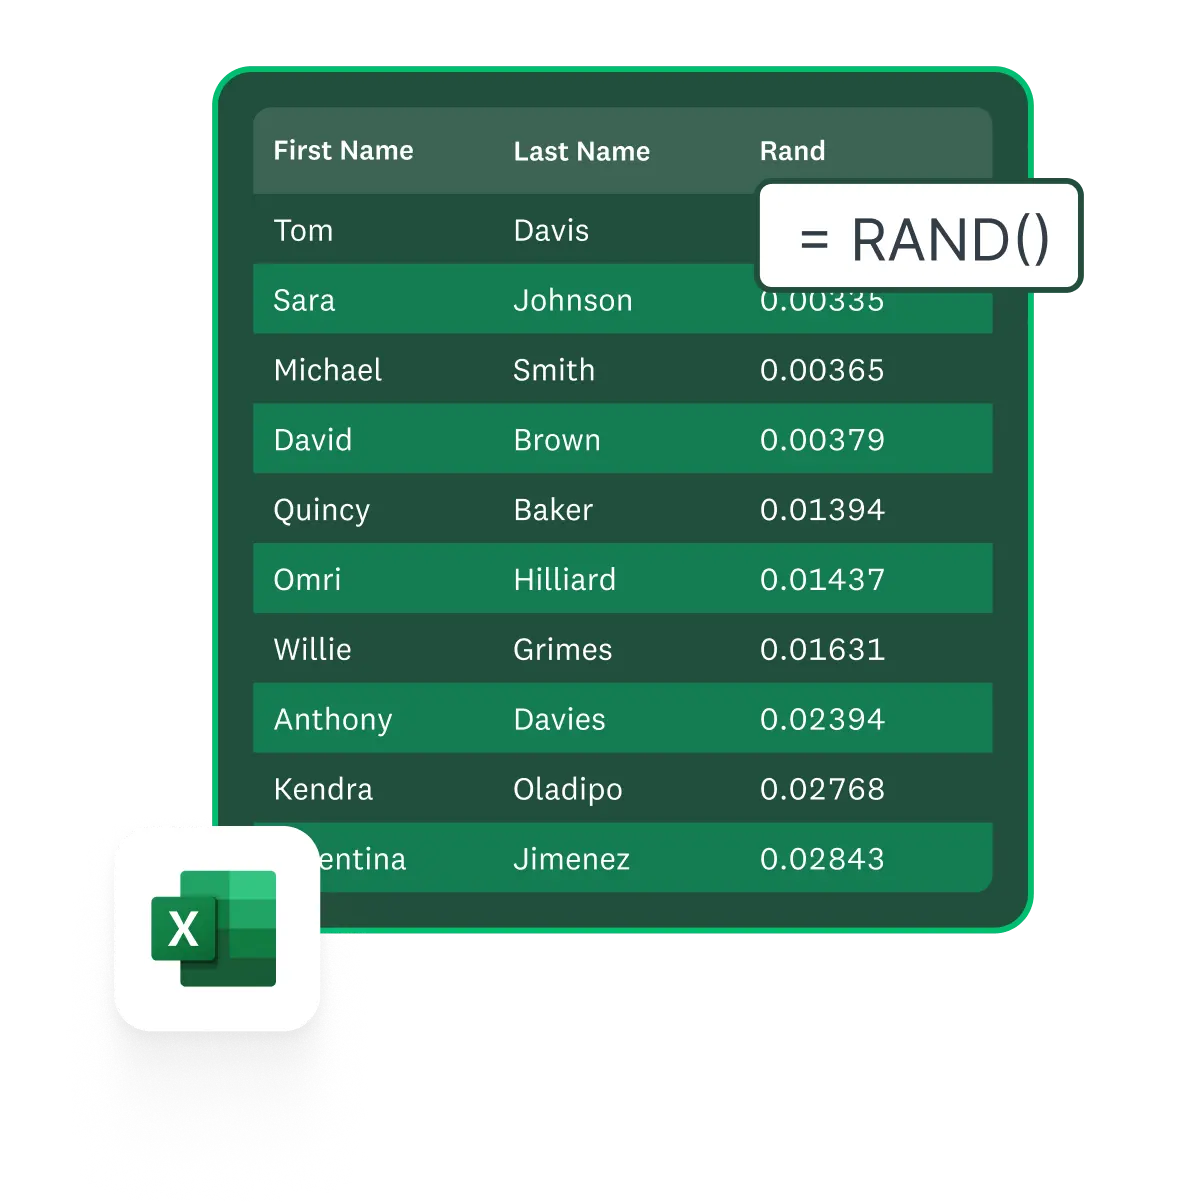
You’ll use the RAND() function, which returns a different value between 0 and 1 every time the worksheet recalculates. Because RAND() is volatile, you’ll finish by pasting values to lock your sample.
Step 1: Insert a Random_number column
Start with a table of your full sampling frame:
- One column of email addresses, or
- Several columns with IDs, attributes, and prior responses
Add a new column to the right of your table and name it something like Random_number.
Step 2: Enter =RAND() and fill down
In the first data row of Random_number (for example, E2), enter:
=RAND()
Fill that formula down so every row in the table has its own random value. This helper column will drive the shuffle.
Step 3: Sort the full table by Random_number
- Select the entire table, including the Random_number column.
- Sort the data by Random_number (ascending or descending; either works).
Sorting on this column reorders all rows based on their random values.
Step 4: Take the first n rows and paste values to lock
Decide how many rows you need in your sample (for example, 500). After sorting:
- Take the first 500 rows from the top of the table. Those rows form your simple random sample.
- Copy that sampled block.
- In a new sheet or area, use Paste values.
Because RAND() is volatile, this “paste values to lock” step keeps the sampled rows fixed so your sample won’t change the next time Excel recalculates. In legacy setups, this helper-column pattern is the main random sampling formula in Excel: insert a Random_number column, fill =RAND(), sort by that column, then take the first n rows and paste values to lock.
Common mistakes (quick checks)
Before you move on, double-check:
- Sorting only the Random_number column instead of the full table (which scrambles your data).
- Forgetting to paste values, so the sample reshuffles later when the sheet recalculates.
- Not filling =RAND() all the way down, which leaves part of the table unshuffled.
How to keep your Excel sample unique and stable
Random sampling in Excel usually assumes that each record appears only once in your sample, especially when each row represents a unique person or account. Methods that shuffle the whole table—like the RANDARRAY + SORTBY lane or the legacy RAND() + sort lane—naturally avoid duplicates, because each row appears once in the original list and once in the shuffled list.
Duplicates are more likely when a formula calls individual rows by position instead of shuffling the whole table. For example, patterns that use RANDBETWEEN to pick row numbers can request the same row more than once. In those cases, a quick duplicate check helps confirm that each ID appears only once in the sample.
If each row has a unique identifier (such as an email address or respondent ID), you can check for repeats in two ways:
- Remove Duplicates (any Excel version):
Select the sampled range, choose Data → Remove Duplicates, and use the ID column as the key. If Excel reports that it removed any rows, the sample contained duplicates and needs another pass. - UNIQUE function (modern Excel):
In Microsoft 365 / Excel 2021+, a formula such as:
=UNIQUE(A2:A501)
can show whether the number of distinct IDs matches your intended sample size. If the UNIQUE list is shorter than expected, at least one record appears more than once.
Volatile functions like RAND, RANDARRAY, and RANDBETWEEN can also cause “re-rolls.” They recalculate whenever Excel recalculates, which means a sample that looked settled can quietly change after a formula edit or a refresh elsewhere in the workbook.
Once your random sampling from a list in Excel looks right, copy the sampled area and Paste values into a new sheet or range so the rows stay anchored even while the rest of the workbook updates.
When you’re sampling emails exported from SurveyMonkey, unique respondent IDs and a quick duplicate check help prevent sending multiple invitations to the same person, while still keeping the sample fair.
Choose a statistically sound sample size
Before you start any random selection in Excel, it helps to know how many responses you actually need. Instead of guessing or using a one-size-fits-all rule, you can use our Sample Size Calculator to set a target that fits your study.
- Open the sample size calculator.
- Enter your population size (for example, 10,000 contacts).
- Choose a confidence level and margin of error that match how precise you need the results to be.
- Use the recommended sample size as your “n” when you follow the Excel steps above.
A statistically sound sample size depends on:
- Population size (how many people are in your list)
- Confidence level (how sure you want to be in the results, such as 95%)
- Margin of error (how much wiggle room you’re comfortable with in the percentages you report)
You don’t need a special rule for a list of 10,000 contacts. The right “n” changes based on your confidence level and margin of error. The calculator will usually show that you can get reliable results from a much smaller group than your full list.
Once you’ve picked a statistically sound target, you can move back into Excel, use that number as your sample size, and apply the modern or legacy lane to select exactly that many rows.
Are you wondering how many people need to take your survey?
Collect the correct number of responses with our sample size calculator.
Alternative methods for random sampling in Excel
Sometimes you just want a quick random pick in Excel without setting up a full shuffle. Two common options are an INDEX + RANDBETWEEN formula and the Analysis ToolPak Sampling feature. These can work as a fast random selector in Excel, but they have some limits.
Single random pick from a list (INDEX + RANDBETWEEN)
If you only need one random item from a list, you can use INDEX with RANDBETWEEN. For a list in A2:A101, this formula chooses one row at random:
=INDEX($A$2:$A$101, RANDBETWEEN(1, ROWS($A$2:$A$101)))
How it works:
- ROWS($A$2:$A$101) counts how many items are in the list.
- RANDBETWEEN(1, ROWS(...)) picks a random position between 1 and that row count.
- INDEX returns the value from that position.
This pattern is helpful when you want a single random pick from a list or need to show how to randomly select in Excel for a quick decision.
When you fill down: duplicates can appear
Trouble starts when you fill that same formula down to get multiple rows. Each copy of RANDBETWEEN is independent, so two cells can request the same row index. That means:
- The same record might appear more than once in the sample.
- Some records might never appear at all.
If you need a true sample without repeats, you have two safer options:
- Use the modern dynamic array lane or legacy helper RAND + sort lane to shuffle the whole table and take the first n rows.
- If you still prefer INDEX + RANDBETWEEN, run Remove Duplicates or a UNIQUE check on the sampled IDs and re-run if you find repeats.
In other words, INDEX + RANDBETWEEN is fine for a quick random sample generator in Excel when you don’t mind the chance of repeats, but it needs extra checks for survey samples.
Analysis ToolPak “Sampling” option
Some Excel versions include a built-in Sampling tool in the Analysis ToolPak, which can act as a basic way to randomize data in Excel.
To turn it on:
- Go to File → Options → Add-ins.
- At the bottom, in Manage: Excel Add-ins, select Go.
- Check Analysis ToolPak and select OK.
- On the Data tab, look for Data Analysis → Sampling.
From there, you can:
- Select your input range.
- Choose Random as the sampling method.
- Enter the number of samples you want.
- Tell Excel where to output the results.
The ToolPak Sampling dialog is useful for quick, ad-hoc experiments, like testing a few rows from a training file or creating a small demo subset. For ongoing survey programs, formulas usually work better because they:
- Document the method directly in the sheet.
- Make it easier to repeat the same logic later.
- Fit cleanly into the modern or legacy lanes you already set up.
You can treat the ToolPak as a convenient random selector in Excel for occasional use, then rely on the formula-based lanes when you need repeatable, documented sampling for survey work.
Common use cases for random sampling
Random samples make it easy to get feedback from a large population for any of the following:
- Customer satisfaction surveys: Random sampling ensures that responses reflect the views of a diverse customer base, leading to more accurate insights into overall satisfaction and areas for improvement.
- Market research: It helps businesses understand consumer preferences and trends without skewing results toward a specific demographic.
- Product testing: Random samples allow companies to evaluate performance and usability across different user groups, ensuring the product meets broad market expectations.
- Quality control: Sampling randomly helps identify defects or inconsistencies in production processes, supporting consistent product standards.
- Academic research: Random sampling is critical for producing generalizable findings and minimizing bias, thereby enhancing the validity and credibility of the study.
Frequently asked questions
- Is there a formula for random sampling?
- How do you generate random data in Excel?
- How do you randomly pick from a list in Excel?
- How can I ensure my random sample is statistically valid?
- My sample changes when I edit a cell. Why?
- I don’t have SORTBY or RANDARRAY. What should I use instead?
- How do I guarantee no repeats?
Turn your Excel random sample into a repeatable research workflow
Random sampling in Excel is much easier once you match your setup to the right method. Modern Excel uses RANDARRAY, SORTBY, and TAKE to return an exact number of rows with one formula, while legacy workbooks rely on a helper RAND() column and a sort. In both lanes, quick duplicate checks and pasting values to lock the results help keep your sample fair and stable.
From there, the workflow is simple: export survey responses to Excel, use the method that fits your version of Excel, and send your next survey to that sampled list. Choose a statistically sound sample size based on your goals, then use templates and integrations to turn that sample into a repeatable research program.
Ready to get started?
NPS, Net Promoter & Net Promoter Score are registered trademarks of Satmetrix Systems, Inc., Bain & Company and Fred Reichheld.
Discover more resources

Solutions for your role
SurveyMonkey can help you do your job better. Discover how to make a bigger impact with winning strategies, products, experiences, and more.

How to create a poll in a text message
From "sent" to "solved"—learn how to create a poll in a text message with SurveyMonkey that wins.

New at SurveyMonkey: AI summaries, smarter charts, and longitudinal analysis
The latest SurveyMonkey updates and features, including AI summaries, modernized charts, and longitudinal analysis.

Online Scheduling Poll Template
Use our Online Scheduling Poll Template to check availability and create a scheduling poll for your next meeting in minutes.