Mobile optimization for surveys: a how-to guide
8 tips to make your surveys look and work great on any device
As the worldwide smartphone market continues to expand, a growing number of survey takers are turning to their mobile devices to complete their surveys.
Roughly 3 in 10 responses to SurveyMonkey surveys in the U.S. are completed on a smartphone or tablet. That number is even higher outside the U.S., reaching 50% in some countries.
The number of SurveyMonkey respondents who choose mobile devices to complete their surveys could soon overtake those who choose desktops. This makes it more important than ever to design your surveys with your mobile respondents in mind.
But mobile optimization for surveys requires a bit more thought. With desktop surveys, you don’t have to deal with the complexities of screen size or operating systems. But surveys look drastically different on a flip phone than they do on a phablet. They also appear differently on Android than they do on iOS.
In order to make sure you get the best possible data, take the time to optimize your survey for your smartphone respondents. Here are 8 tips on mobile optimization for surveys:
1. Avoid large matrix questions
Due to their horizontal formatting, the text wrapping on large matrix questions can be extreme and make it difficult for respondents to view the question properly on mobile devices. Try to limit the number of answer choices (columns) and question items (rows) to no more than five each. Be as concise as possible when writing answers and questions.
If it isn’t possible to scale down your matrix questions, try to separate your large matrix questions into a series of smaller matrix questions. Better yet, don’t use matrix questions at all, and instead break them out into individual questions.
2. One vertical column is best multiple choice questions
When formatting your response options for multiple-choice questions, it’s best to keep them vertical. Like matrix questions, horizontal response options may produce text wrapping that’s difficult to read.
Using drop-down response options usually isn’t a good option either. They’re harder to read on mobile devices because respondents have to click AND scroll to see all the answer options. That means respondents may not see all of the options you’ve included, or scroll through them too quickly, which could bias the responses you get.
One vertical column is the easiest reading experience for your respondents, which means better data for you to analyze.

3. Limit the number of open-ended questions
It’s easy to make errors when typing on the small keyboards of smartphones, so limit the number of open-ended questions (e.g., comment boxes, numerical textboxes) in your survey.
4. Be cautious adding images and videos
Videos load quickly when you’re connected to an Ethernet cable or a fast Wi-Fi connection, but many smartphone respondents rely on cell phone networks to load data. A video that instantly plays on a laptop or desktop could take much longer to load on a smartphone. These respondents may get frustrated and skip your survey, so consider limiting the amount of multimedia in mobile optimized surveys.
5. Keep it short
Survey takers on mobile devices are typically responding on the go, so it’s important to be mindful of their time. It’s best to keep any survey as short as possible to ensure no one drops out halfway through.
6. Split up your questions
Try to limit the number of questions per page to two or three so that smartphone respondents don’t have to scroll too much to get to the next question. Scrolling can cause respondents to inadvertently click on the wrong response option as they try to reach questions towards the bottom of the page.
However, if your survey is long, it can be cumbersome to have to wait for each page to load. Try to find a good balance of length, pages, and number of questions per page.
7. Use small logos and avoid progress bars
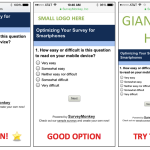
Logos can take up valuable screen real estate. For surveys that you expect people will complete on their smartphones, take out the logos. At the very least, use logos that are small enough that they don’t overshadow what’s really important: the actual survey question.
The same goes for progress bars. They are often too distracting and take up too much of the screen, forcing people to scroll down to see the question. Mobile optimization for surveys works best when you avoid those logos and progress bars.

8. Test it in the right environment
The final check in any survey is to test it out in order to catch any typos and confirm you’ve properly programmed your skip logic. Don’t forget to test out your survey on BOTH your computer and your smartphone. If you have access to both an Android phone and an iPhone, it would be ideal to test out your survey on both. By experiencing the survey in a mobile environment, you’ll be able to see first-hand which questions or pages don’t follow the points already mentioned in this guide.
Discover more resources

Toolkits directory
Discover our toolkits, designed to help you leverage feedback in your role or industry.

How to make your data collection more secure

Boost survey response rates with these 20 email templates
Enhance your survey response rates with 20 free email templates. Engage your audience and gather valuable insights with these customizable options!

P-value calculator: How to calculate p-value
Leverage our p-value calculator to find your p-value. Plus, learn how to calculate p-value and how to interpret p-values with our step-by-step guide.