How to use correlational research to spot patterns and trends
Correlational research can show whether there's a relationship between two variables. Survey studies can confirm your findings.

You may be more familiar with correlational research than you realize. When the doorbell rings at a particular time of day, you know it's the mailman dropping off a package. You reached that conclusion after observing the doorbell and the mailman, two variables, over time and noticing a relationship between them. That's essentially correlational research.
Explore SurveyMonkey LaunchPad
Run guided research studies with your target audience and get automated insights without building the analysis by hand.
What is correlational research?
Correlational research is a non-experimental research method in which two variables are observed to establish a statistically corresponding relationship between them. Its goal is to identify variables where a change in one creates a change in the other, without influence from any extraneous variable.
Correlational research has, for example, identified a relationship between watching violent television and aggressive behavior. But correlational isn't the same as causal: to prove that viewing violent shows causes aggression, experimental studies were needed. Correlational research established that a relationship existed; experimental research was needed to prove what kind of relationship it was.
Characteristics of correlational research
Correlational research is one of several types of research design, with three defining characteristics.
- Non-experimental: in correlational research, there is no manipulation of variables with a set methodology to prove a hypothesis. It is a simple observation and measurement of the natural relationship between two variables without the interference of any other variables.
- Backward-looking: the future is not a consideration in correlational research. It observes and measures the historical relationship between two variables. The statistical pattern is backward-looking and can cease to exist in the future. The relationship between the variables may be revealed as positive in the past but can change to negative or zero in the future.
- Dynamic: the statistical patterns from correlational research are dynamic. The correlation can change on a daily basis, so it cannot be used as a standard variable for further research and analysis. Two variables could have a positive correlation in the past and a negative correlation relationship in the future.
Advantages of correlational research
There are several benefits to conducting a correlational research study:
Variable management
There is no need to set up a controlled environment or staged interaction. In correlational research, you simply observe the two variables, their natural relationship, and their effects on each other. Observation takes place in the natural environment of the variables, and neither variable is manipulated.
Data collection
Correlational research generally involves two or more sets of data. By conducting correlational studies over time, you can observe patterns and trends that establish further relationship attributes. Data can either be collected by observation or archival data, which we will discuss in more detail later in this article.
Target market identification
Used in marketing, your correlational research may help you identify a new potential target market. For example, if you observe shoppers at a local grocery for an entire week, you might conclude that older shoppers tend to visit the store early in the morning. This relationship between time of day and customer age will help you target your advertising appropriately.
Ethical
Correlation research is conducted through observation only. In cases where experimental research is considered unethical, correlational research may be used to establish whether there is a relationship between two variables.
Economical
Correlational research takes less time and capital to conduct than experimental research. This is a particular advantage when working with limited funding.
Limitations of correlational research
As with any research method, there are limitations to correlational research:
Limited in scope
Correlational research is limited to providing statistical information from two variables only. It can uncover previously unknown relationships, but it cannot provide a conclusive reason for why the relationship exists.
No causal data
This research method only identifies a relationship between variables, it does not identify which of the variables creates the statistical pattern or which variable has the most influence. There is no evidence for cause and effect, so another research method must be used to determine the causal relationship.
Depends on historical data
Because correlational research depends on the past to determine the relationship between the variables, it cannot be a reliable source as a standard variable for future predictions.
Correlational vs. experimental research
Correlational and experimental research differ in four main ways.
| Methodology | Correlational research | Experimental research |
| Methodology | The researcher simply observes the variables, watching for a natural statistical pattern; no trigger or catalyst is introduced | The researcher introduces a catalyst or trigger to evaluate its effect on the variables |
| Observation | Passive: the researcher observes and measures the relationship between variables | Active: the researcher triggers a change in the variables and observes the resulting reactions |
| Causality | Establishes a statistical pattern connecting two variables, but not cause and effect | Establishes a causal relationship by introducing a catalyst and measuring its effect |
| Number of variables | Limited to two variables | Can include an unlimited number of variables |
Types of correlational research
There are three possible outcomes of correlational research, expressed through a correlation coefficient, a measure of the strength of the correlation that ranges from -1.00 to +1.00.
Positive correlation
This type of correlational research method involves two statistically corresponding variables where an increase or decrease in one variable creates a like change in the other. A correlation coefficient close to +1.00 indicates a strong positive correlation.
Example: when income increases, spending increases.
Negative correlation
Negative correlational research involves two statistically opposite variables where an increase in one variable creates a decrease or alternate effect in the other. A correlation coefficient close to -1.00 indicates a strong negative correlation.
Example: if prices in a store increase, sales then decrease.
No correlation
No correlation, or zero correlational research involves two variables that may not be statistically connected. A change in one variable may not trigger a corresponding or alternate change in the other. A correlation coefficient of 0 indicates no correlation.
Example: a person’s height has no correlation with the salary they earn.
When to use a correlational research design
Correlational research is frequently used in market research. You can gather data quickly and easily with observation and generalize your findings. This is helpful in finding out what areas require further research.
Using correlational research is a good option for these situations:
Investigation of non-causal relationships
Use correlational research when you want to find out if there is a relationship between two variables, but don’t expect to find a causal relationship. In market research, you may discover that people shop more when it’s cold outside. This does not mean that cold weather causes frenzied shopping sprees, but it does show a pattern of behavior.
Exploration of causal relationships between variables
You can use correlational research to discover initial indications or develop theories if you think there may be a causal relationship between two variables, but it is unethical, cost-prohibitive, or impractical to perform experimental research. Continuing the example from above, you observe trends that imply a causal relationship between an increase in shopping and the months of November and December.
Testing new measurement tools
When you develop a new tool for measuring your variables, you can use correlational research to assess whether the tool is consistent and accurate. If you created a new scale to measure customer satisfaction, correlational research would verify its accuracy.
How to run a correlational research study: step by step
- Identify your two variables. Correlational research only supports two variables at a time, so decide exactly which two you're studying and what relationship you suspect, without assuming causation.
- Choose your data collection method. Pick naturalistic observation, archival data, or a correlational survey, based on how much control you have over collecting new data versus relying on what's already been recorded.
- Collect your data. Gather data over a meaningful period of time. A single snapshot won't reveal a pattern; correlational relationships emerge from data collected across multiple points in time.
- Calculate the correlation coefficient. Use the Pearson correlation method (Pearson's r) to summarize the strength and direction of the relationship as a single number between -1.00 and +1.00.
- Interpret and report your findings. State clearly whether the relationship is positive, negative, or nonexistent, and be explicit that correlation doesn't establish causation, since that distinction is where most correlational research gets misread.
Correlational research methods
There are three methods of data collection used in correlational research: naturalistic observation, archival data, and surveys.
Each method has its own distinct features:
Naturalistic observation
This correlational research method involves observation of people in their natural environments over a period of time. The researcher must carefully observe the natural behavior patterns of the subjects (variables).
The difficulty inherent to this research method is that the researcher must not let the subjects know they are being observed. If the subjects are aware of the observation, they may deviate from their usual behaviors. They may refrain from participating in certain activities or behave in what they perceive to be a “correct” manner because they are being observed.
The advantage of naturalistic observation is that researchers can observe the subjects in their natural environment, offering an inside look at social behaviors that are unlikely to be observed in a test setting.
Archival data
This correlational research method uses information that has already been collected about the variables in the research. By using data from earlier studies or historical records (secondary research) of the variables, the researcher can track statistical patterns that have already been determined.
The missing piece with archival data is the reliance upon data that has not been collected by the researcher with their intent and goal in mind. Because it is not primary research, the researcher has no control over the methodology by which it was collected. It may also be difficult to find existing research that aligns with the researcher's current subject.
Surveys
The most commonly used correlational method is the survey method. Surveys containing questions about the subject of interest are administered to a random sampling of subjects (variables). The most efficient way to conduct correlational research with surveys is to use an online platform.
SurveyMonkey is an agile market research platform that has solutions for all of your research needs. Our solutions include all the tools you need to perform survey research, including data analysis and a customizable dashboard for presenting your results.
Surveys allow researchers to gather a lot of information in a short amount of time. Keep in mind that it is critical to avoid any survey bias that could affect the validity of the results.
How to analyze correlational data and identify trends
Once your data is collected, you can statistically analyze the relationship between the variables with either correlation or regression analysis, or both. The relationship between the variables can also be visualized using a scatter plot.
Correlation analysis
In correlation analysis, you summarize the relationship between the variables with a correlation coefficient. To determine the number that describes the strength and linear correlation between two variables, you will use the Pearson correlation method or Pearson’s r. The number you arrive at using this method is your correlation coefficient.
In very basic terms, the Pearson correlation uses a scatter plot of your collected data by drawing a line through it to determine if there is a positive, negative, or no relationship between the variables as well as the statistical significance of the correlation.
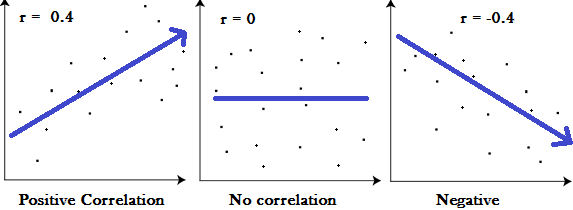
Once performed, the Pearson correlation method yields a number from -1.00 to +1.00. The value of “r” represents the strength of the relationship between the two variables.
This is the expression for calculation of the correlation coefficient r:

Once the value of r is determined, you must determine whether it is of statistical significance.
Regression analysis
Using regression analysis, you can use your collected data to predict how much change in one variable will be associated with a change in the other variable.
Where correlation analysis quantifies the linear relationship between two variables, regression analysis expresses the relationship in the form of an equation. Neither analysis establishes a cause-and-effect relationship.
Examples of correlational research
The following examples will help clarify the uses and analyses of correlational research.
A business notices a decline in the sales of kitchen appliances. They conduct correlational research and find that there is a relationship between recent price increases and declining sales—a negative correlation. They can use survey studies to confirm a causal relationship and take steps to improve sales.
A nutritionist wants to determine if there is a relationship between veganism and general health. She conducts archival correlational research on people with varied diets. Her statistical analysis will show whether those on a vegan diet have better overall health.
You hypothesize that older people are more patient than their younger counterparts. You conduct correlational research by observing people waiting in line at the grocery store. Your analysis shows a strong positive correlation between age and patience.
Frequently asked questions about correlational research
What is correlational research?
Correlational research is a non-experimental research method that observes two variables to establish a statistically corresponding relationship between them, without proving that one variable causes a change in the other.
What is a correlational survey?
A correlational survey is a survey administered to a random sample of subjects to gather data on two variables of interest, making it the most commonly used method for collecting correlational research data, typically run through an online survey platform.
When should you use a correlational research design?
Use a correlational research design when you want to know if two variables are related without expecting or needing to prove causation, when you suspect a causal relationship but experimental research would be unethical, too costly, or impractical, or when you're testing whether a new measurement tool produces consistent, accurate results.
What are examples of correlational research?
Examples of correlational research include finding a negative correlation between price increases and product sales, an archival study comparing diet type to general health outcomes, and an observational study finding a positive correlation between age and patience while waiting in line.
Are you using correlational research?
Correlational research is a critical tool for establishing relationships between two variables. While it can't determine causality, it can detect a positive, negative, or zero correlation, useful for spotting patterns and trends you might not otherwise notice.
When you're ready to conduct your own correlational research, find your target population quickly with SurveyMonkey Audience, or explore SurveyMonkey LaunchPad for guided, automated research studies. If you'd rather hand the legwork to someone else, SurveyMonkey Market Research Services can design, field, and analyze a custom study for you, from questionnaire design through the final report.
Get started with your market research
Global survey panel
Collect market research data by sending your survey to a representative sample
Research services
Get help with your market research project by working with our expert research team
Expert solutions
Test creative or product concepts using an automated approach to analysis and reporting
To read more market research resources, visit our Sitemap.