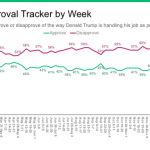
This past week, SurveyMonkey’s tracking finds 43 percent of Americans approve of the way Donald Trump is handling his job as president, and 55 percent disapprove.
In some ways, SurveyMonkey’s weekly updates provide an ongoing lesson in random statistical noise. This week’s approval percentage, for example, is a percentage point higher than last week, the same as the week before, and a point lower than the two weeks before that. In fact, since late December, SurveyMonkey’s weekly approval over the past two months has varied between 42 and 44 percent except for only one release (40 percent in early January).
All surveys have some random statistical noise due to sampling, even those with very large samples. Our modeled error estimate is typically +/- 1.5 percent, meaning that results could vary within a three percentage point range in any given week by chance alone (due to an especially large sample, this week’s modeled error statistic is +/- 1 percent).
Since December 29, SurveyMonkey’s tracking estimates of Trump’s approval averaged 42.7 percent, which is consistent with most of the week-to-week variation we have seen over that period, given our typical modeled error of +/- 1.5 percent. (SurveyMonkey’s estimates do tend to produce larger numbers for both approval and disapproval than other polls, because we do not prompt for “unsure;” more details on why here).
Do not mistake the recent stability, however, for a lack of trend over the past year. There have been two lasting inflection points. The first came in early May 2017, when Trump’s approval dipped modestly as the U.S. House approved a Republican plan to “repeal and replace” President Obama’s signature health reform law and Trump fired then FBI Director James Comey. The second came in late December, when Trump’s approval ticked up following passage of the Republican tax bill into law.

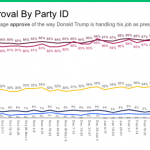
These subtle shifts show up when we plot Trump’s approval by party identification, although the partisan polarization about Trump is so pronounced – with 80 percent or more of Republicans consistently approving compared to less than 10 percent of Democrats – that it can be hard to see trends over time.

However, if we average across weeks, the recent uptick in Trump’s rating comes into clearer relief. Since the Fall, his approval rose 4 percentage points (from 84 to 88 percent) among Republicans and Republican-leaning independents, 2 percentage points (from 32 to 34 percent) among independents who lean to neither party, and changed not at all (7 percent stable) among Democrats and Democratic leaners.

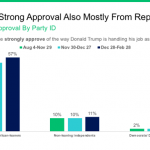
Something similar occurred in recent months in the percentage who strongly approve of Trump’s performance, which was 24 percent over the past week (while nearly twice as many, 45 percent, strongly disapprove).

Again, averaging across weeks shows that Trump’s strong approval rose 7 percentage points (from 50 to 57 percent) since the Fall of 2017 among Republicans and Republican-leaning independents, just 1 point (from 10 to 11 percent) among independents who lean to neither party, and changed not at all (2 percent) among Democrats and Democratic leaners.

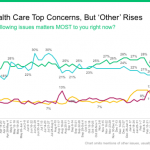
While Trump’s approval has been stable in recent weeks, the shootings at Marjory Stoneman Douglas High School in Parkland, Florida helped change perceptions of the issue that matters most. Since the shootings two weeks ago, mentions of “jobs and the economy” dropped five percentage points (from 28 to 23 percent). Meanwhile, the percentage who clicked “other” to indicate that the most important issue was not among the eight provided rose from 8 to 13 percent.

Our analysis show that roughly a third of those who clicked “other” – 4 percent of all adults – used the words “gun,” “shooting,” “weapon,” “rifle” or “school safety” to describe the issue they say matters most right now. The same responses accounted for 3 percent of all adults the previous week. Those responses explain all of the increase in the volunteered “other” category.
Methodology: This week’s SurveyMonkey Tracking poll testing President Trump’s approval rating was conducted online February 22 through 28, 2018 among a national sample of 31,777 adults. Respondents for this survey were selected from the nearly 3 million people who take surveys on the SurveyMonkey platform each day. Data for this week have been weighted for age, race, sex, education, and geography using the Census Bureau’s American Community Survey to reflect the demographic composition of the United States. The modeled error estimate for this survey is plus or minus 1.0 percentage points. More details on SurveyMonkey's methodology are available here.


