Last week, I posted about how to use our new Text Analysis features to get a quick summary of your open-ended text responses. Today, I will show you how to use Text Analysis to categorize your text responses and turn qualitative data into quantifiable responses you can perform further analysis on.
Categorizing, or coding, text responses is a common way to systematically analyze the feedback in open-ended answers. And now you can do it all right in SurveyMonkey–no downloading and no manual counting!
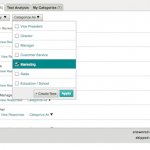
There are a few different ways to put a text response into a category. The first is to select a category for a single response from the Responses tab in your summary report. When you click to view text responses for any question, you will see that each response has a “Categorize As” link. Clicking there will open a drop-down menu that includes all the categories you have already created for that question (You can always create a new category by clicking on the ‘Create New’ button):

Clicking on a category name will put the response into that category. You can also select multiple categories using the checkboxes, then click ‘Apply’ to put the response in all of the selected categories at once.

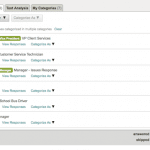
After you have put a text response into one or more categories, you will see a color-coded tag next to the response for each category:

You can also apply categories to multiple text responses at the same time. To do that, simply select all of the text responses you want to categorize by clicking on the checkboxes to the left of the text. (You can also click on the checkbox at the top left of the Responses window to select ALL text responses.) Once you have all the responses selected, click on the ‘Categorize As’ button at the top of the Responses window. You will see the same drop-down menu as described above for the single text responses. From there you can apply one or more categories to all selected responses:
Pro Tip: Combine our text analysis features for easy categorizations. You can click on any of the words from the word cloud in the Text Analysis tab to get a filtered list of responses that include that word or phrase. Then, use the top checkbox to select all responses and you can easily categorize all of the responses that include the word or phrase.
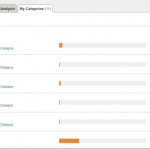
Once you have categorized your responses, click on the My Categories tab to see the number of responses in each of your categories. You now have quantitative analysis of your open-ended text responses:

The percentages displayed at the right show the portion of total responses for that question. (NOTE: the percentages won’t always add up to 100%, because responses can have multiple categories, and in the case of multiple-choice questions, not every response is necessarily an open-ended text response.)
Pro Tip: At the bottom of the list of categories in the My Categories tab, you will see a listing for Uncategorized responses. This will tell you how many responses have not been placed into any category yet. It also provides a simple way to read through only the uncategorized responses. Just click on the ‘Uncategorized’ tag or the ‘View Responses’ link beneath it, and you will return to the Responses tab, filtered to display only the uncategorized text entries.
Your categories will be saved with your data so you can always come back and see them. They’ll also be included in the file when you download your data.
So if you always wanted to count the ‘other’ responses together with the multiple-choice responses, or you wanted to count ‘positive’ answers vs. ‘negative,’ or just tag some of the open-ended responses as ‘favorites,’ now you can do all of that–without leaving SurveyMonkey.
Have questions about our new Text Analysis features? Please feel free to ask in the comments below.
Josh is a Sr. Product Manager at SurveyMonkey, and author of The Double-Down Guide to Blackjack.


