Let’s set the scene real quick, shall we? You launched your survey, analyzed all those wonderful responses and now you’re ready to (gulp) share what you’ve learned. Maybe you’re reporting back results to colleagues, your boss, clients or customers. Whoever your audience is, wouldn’t it be great if you could share it in one of the most popular presentation formats around? Like say, PowerPoint?
Well, we’ve got good news for you—now you can.
That’s right, in addition to setting up a Shared Results page and our suite of export options—Excel, CSV, PDF—you can now present your survey data using Microsoft PowerPoint. Until now, you’d have to export individual charts to image files to use in your PowerPoint presentations and recreate data tables yourself. With the new PowerPoint Exports feature, you can download a PowerPoint presentation pre-filled with all your charts and data tables, with editable title slides and question text. You can export the PPTX file and present it as is, or add call-outs and explanatory text as you need it.
Ready to take a look? Let’s go.
How to Download a PPTX File
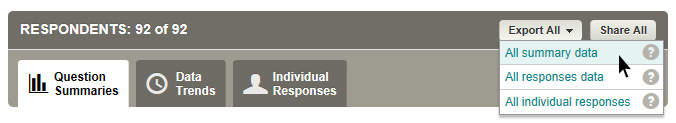
You can find PowerPoint Exports in the same place as our other export formats (Excel, PDF, etc.). Just click on any of our standard Export buttons and select Summary Data.
We’ve added the PowerPoint format (PPT) alongside the PDF, XLS and CSV export formats. When you click on PPT, you will get the export options for the new format.
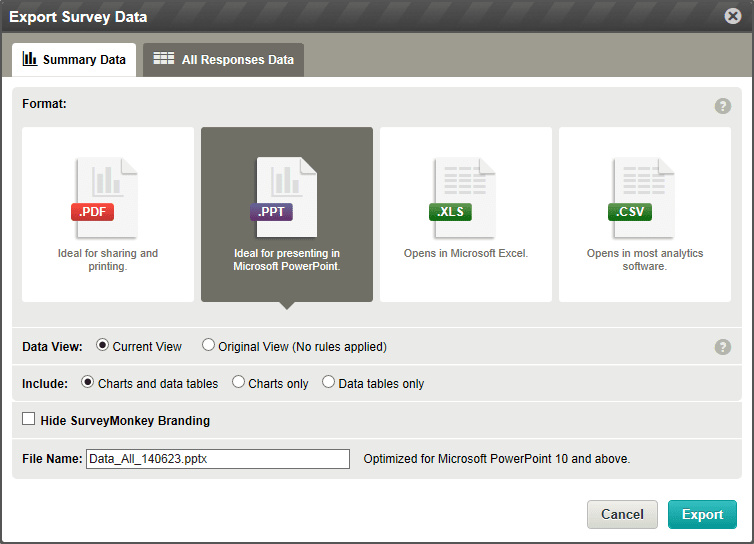
For PowerPoint Exports, there are two new settings. First, you can choose whether you want your presentation to include a chart and a table for every question, or to include only charts or only data tables. This will save you a lot of time adjusting the slides after you download your file.
If you have a paid plan, you can also hide the SurveyMonkey branding in the PowerPoint file. We won’t include our logo and name in your file. Just check the checkbox next to Hide SurveyMonkey Branding to turn this feature on.
Your file will appear in the same place in the left column as all your other exports. Note: The file will be a .PPTX file, which means it won’t open if you’re using any version of PowerPoint earlier than PowerPoint 10.
What Will Your PowerPoint Presentation Look Like?
Your PowerPoint presentation will include a title slide, a summary slide, and two slides for each question (one for the chart and another for the data table).
The title slide uses your survey title (though the text is editable if you want to change your presentation title). It also includes the current date, i.e. the date on which you request the export file.

The title slide is followed by a Summary Slide, which summarizes your survey data. It includes the number of responses you received, as well as the number of complete responses. Plus, it shows the date you first created your survey. All of this text is also editable, so you can customize as needed.

Depending on which setting you chose when you exported your data, you will get one or two slides for each of your questions. As a default, you’ll get one slide with the chart and one slide with the data table for each question. Note: We only include closed-ended questions in the PowerPoint presentation. We do not display your text responses to essay, textbox, and date/time questions.
For each slide, we include the question text as the slide title, as well as the number of respondents who answered and skipped that question.
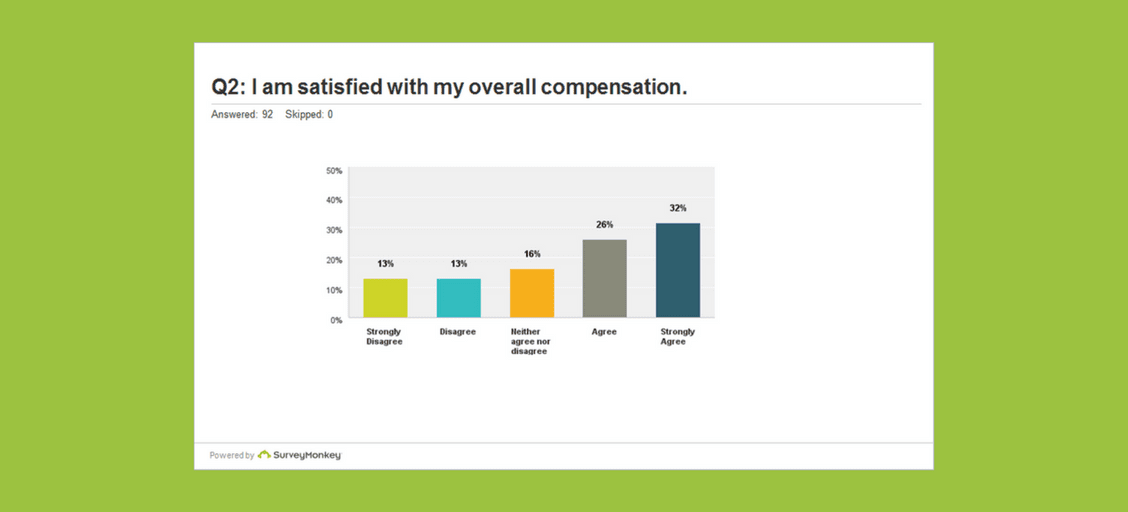
The chart and/or data table are included in the presentation as images, so you can move, resize, or remove them as needed. Also note that any customizations you have made on the Analyze page to either the chart or the data table will be reflected in the Powerpoint presentation. As you can see below, we changed the chart type to a vertical bar chart and displayed the data on the chart.


We hope you’re as excited as we are about this newest export option. Look for more sharing and reporting features in the future, but for now, good luck with that presentation of yours!
Questions, comments? Let Josh know.