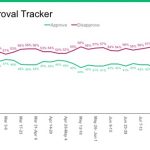
President Donald Trump’s overall job rating stands at 40 percent approve, 59 percent disapprove in SurveyMonkey tracking for the week from August 25 through August 31.
While Trump’s ratings have plateaued in our tracking over the past six weeks – varying between 39 and 41 percent – his approval ratings have shown a slow but steady decline throughout 2017.

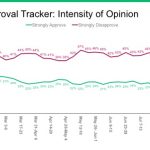
This week, strong disapproval of Trump ticked up to 48 percent, a point higher than the previous week and the highest level measured to date in SurveyMonkey’s tracking. The intensity gap between strong disapproval and strong approval has been better than two-to-one for the past six weeks.

Trump’s approval trending downward has led to a debate about what these numbers portend for Trump and the Republicans in 2018 and beyond. Some see the President’s support “cratering” and speculate about whether he might face a primary challenge in 2020. “Not so fast,” says NBC’s Steve Kornacki, who points out that Trump won despite historically catastrophic numbers and might do so again.
While predictions about 2018 or 2020 are obviously premature, our colleagues at FiveThirtyEight have tried to focus this conversation on Trump’s “Reluctant” voters, those who say they were “not excited” to cast their ballots for Trump in 2016. That’s a relatively small slice: Just 14 percent of self-reported Trump voters in our last survey, and 5 percent of registered voters. But make no mistake, they were big enough to have swung the election to Trump in the states he won narrowly that provided his Electoral College margin.
“They’re the group to watch,” FiveThirtyEight’s Claire Malone argues, because their continuing support, “might mean the difference between a successful Trump presidency or a failed one, between the GOP holding or losing the House.”
Last week, FiveThirtyEight reported on a new batch of SurveyMonkey data showing that more than half of the reluctant Trump voters still approve of his performance, his approval rating with this group declined 11 points (from 74 to 63 percent), with fewer stronglyapproving Trump’s performance (6 percent) than strongly disapproving (14 percent).
The absence of intense support among Trump’s “reluctant” supporters helps highlight a larger and often overlooked pattern in the approval data: Trump’s troubles are even more apparent when it comes to intensity of support.
Again, strong disapproval of Trump (48 percent) is now better than twice as high as strong approval (22 percent), an intensity gap that has been growing.
What does this mean for Trump’s base? The results show a split. About half of Trump’s 2016 voters (54 percent) strongly approve of his performance. Nearly all of these strong Trump supporters are hopeful about the Trump presidency in the months ahead (88 percent are very hopeful) and plan to support his reelection in 2020 (88 percent say they will definitely support Trump).
But among the other 46 percent of Trump’s voters there are problems. Most of these, 37 percent of the total, only somewhat approve, but 9 percent of Trump’s voters now say they disapprove of his performance,
Let’s focus for a moment on the Trump voters who only “somewhat approve” of his performance. Eighty-one percent identify as Republicans or lean that way, and most (82 percent) told us they would likely vote to reelect Trump in 2020 (on a question that did not specify whether the alternative was a Democrat or a Republican primary challenger).
However, their lack of enthusiasm could translate into lower enthusiasm and turnout for Republican Senate and House candidates in 2018. Among the “somewhat approving” 2016 Trump voters, just 26 percent told us they are “very hopeful” about the Trump presidency in the months ahead (though a total of 80 percent are at least somewhat hopeful).
Trump retains a loyal base that continues to back him with great intensity — the 22 percent of Americans who as of this week, strongly approve of his performance — but that base falls far short of a majority. If the President cannot begin to inspire more hope and enthusiasm among those who helped put him into office, his road ahead will continue to be difficult.
This week’s full approval topline results and a detailed demographic breakdown can be viewed here.
Results from previous weeks can be accessed here.
Methodology: The lastest SurveyMonkey Tracking poll was conducted online August 25 through August 31, 2017 among a national sample of 12,032 adults ages 18 and up. Respondents for this survey were selected from the nearly 3 million people who take surveys on the SurveyMonkey platform each day. Data for this week have been weighted for age, race, sex, education, and geography using the Census Bureau’s American Community Survey to reflect the demographic composition of the United States. The modeled error estimate for this survey is plus or minus 1.5 percentage points.


