Let’s say you’re a big time music label guy. This kid named Kevin walks into your office with a copy of his new song called, I Like Popsicles. You tell him no one is going to listen to a song about popsicles. He says he’ll show you how wrong you are.
He shows you a survey where he asked two people (his parents) and 100% of them said they would love to listen to his song. Such a positive response! “Kevin,” you say gently, “we’re not selling music to your family, we’re selling music to Americans—or maybe American kids, given the subject matter of your song.”
Kevin looks a little sad. “Okay,” he asks, “how many people do I have to survey to convince you?
That is an excellent question.
How many people does Kevin need to ask? How many people do you need to send your own survey to? Go through these five steps and you’ll have your answer…
Step 1: Figure Out Your Population
1a. Decide what your population is. Remember, your population is the entire set of people you want to study with your survey.
For example: If you want to market Kevin’s song to American kids, the population would be all Americans less than 18 years of age.
1b. Figure out how many people (roughly) are in your population.
For example: There are roughly 75 million kids in America.
Step 2: Decide How Accurate You Want To Be
Because you’re not surveying your entire population, your results won’t perfectly match what the whole population thinks. You’ll have to decide how much of a risk you’re willing to take that your results will be a bit off from the whole population.
2a. Decide how sure you want to be that your responses reflect the views of your population. This is called the margin of error.
For example: 90% of your sample hates Kevin’s song. A 5% margin of error would add 5% on either side of that number, meaning that actually 85-95% of your population (American kids) who hate Kevin’s song.
Tip: 5% is the standard, most commonly used margin of error, but you may want anywhere from 1-10% for a margin of error depending on your survey. Avoid increasing your margin of error above 10%.
2a. Decide how sure you want to be that your sample accurately samples your population. This is called the confidence level. In other words, how sure do you want to be that it wasn’t the particular sample you picked – perhaps full of popsicle lovers and relatives of Kevin – that’s driving your results? How sure do you want to be that any other sample from your population would give you the same results?
For example: A 95% confidence level means that, even if you picked different samples from the population, you’d get the same number of people hating Kevin’s song 95% of the time.
Tip: 95% is the standard, most commonly used confidence level but you may want a 90% or 99% confidence level depending on your survey. Decreasing your confidence level below 90% is not recommended.
Step 3: Decide How Big Your Sample Should Be
Remember, your sample is the people who actually take the survey. Not everyone who is sent a survey fills it out, so your sample size isn’t how many people to send it to, but how many completed responses you need.
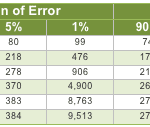
Now that you have your numbers from Step #1 and Step #2, check out this handy chart below to figure out how big a sample you’ll need. Or get more specific numbers with our sample size calculator.

Note: These are intended as rough guidelines only. Also, for populations of more than 1 million you might want to round up slightly to the nearest hundred.
For example: There are 75 million American kids, so, at the very least, you need 384 people. Rounded up, that makes 400 people. Note: These are intended as rough guidelines only. Also, for populations of more than 1 million you might want to round up slightly to the nearest hundred.
Tip: Since most populations are over a million people, you will want about 400 responses (rounded up from 384).
But wait! We’re not quite done yet…
Step 4: Estimate Your Response Rate
The percentage of people who do actually fill out a survey that they receive is known as the “response rate.” Of course, you won’t know what your exact response rate will be until you send out the survey. But you’ll need to guess what it’ll be in order to calculate how many people you need to send your survey to.
Response rates can be different depending on many things. Some examples are the relationship with your target audience, survey length and complexity, incentives, and the topic of your survey.
A great response rate for online surveys is about 20-30%. A safer and more conservative guess, especially if you haven’t surveyed your population before, is 10-15%.
For example: You have never surveyed American kids and want to be on the safe side, so you pick a response rate of 10%.
Step 5: Calculate How Many People to Survey
This part’s easy!
Just divide the number you got from Step #3 by the number you got from Step #4. That’s your magic number.
For example: You need 400 American kids to fill out your survey and you think about 10% will actually fill it out. You’ll divide 400/10%, which means you need to send your survey to 4000 kids.
So good luck to you (and Kevin)! And happy surveying…


