

Measuring change the traditional way
When something changes in your business strategy or in the world at large, it can cause shifts in attitudes, opinions, and behaviors. It could be a viral marketing campaign that you hope influences purchasing decisions, a new benefit you just introduced to your employees that might improve retention, a major political event that could change the results of an election, or a new disease that makes people more worried about their health. Whatever it is, you need to ask questions to know the impact.
The simplest way to ask about change may be to just ask:
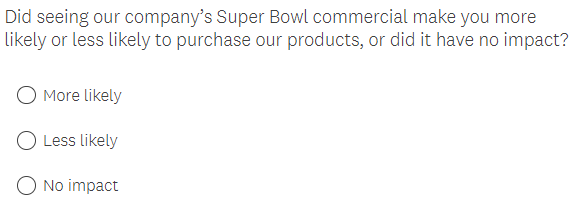
Let’s call this type of question the “change format.” It’s a standard type of survey question.
Interpreting the data for this type of question is straightforward; if 65% of people who saw your commercial say it made them more likely to buy your product, that’s a win! But what does that number mean? Are those people more likely to buy your product because of the commercial they saw, or are they expressing enthusiasm for the product in general?
Survey respondents sometimes answer the question they want to answer, rather than the question they were asked; this is called “response substitution.” In our example above, they might answer with their overall impression of the product rather than how the commercial changed their opinion. Those who said “more likely” might be trying to say that they are very likely to buy the product, while those who say “less likely” might be expressing that they don’t want to buy the product at all – not taking the commercial into consideration. This can inflate your metrics and mislead you into thinking that your commercial had a stronger impact than it did.
An alternative way to ask about change
There’s another way to make sure you are measuring the real impact; ask your respondents about their current opinion, and then pose a hypothetical situation in which respondents didn’t know about the event and ask them to imagine what their opinion would be in that situation.
What would that look like in our Super Bowl example above? You would ask two questions:
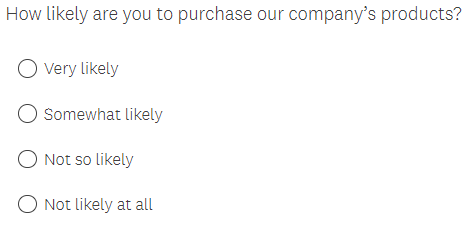
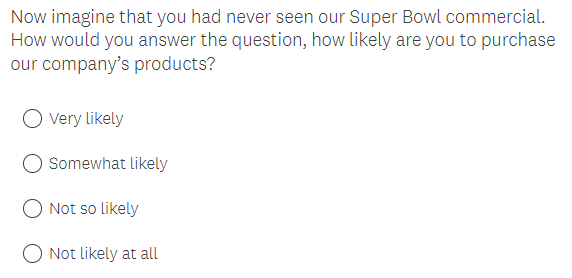
This is the “counterfactual format,” a new method of measuring change. This format works differently from the change format because respondents are given the chance to express their current attitude, not just whether their attitude changed. Respondents get to answer both the question they were asked and the question they wanted to answer.
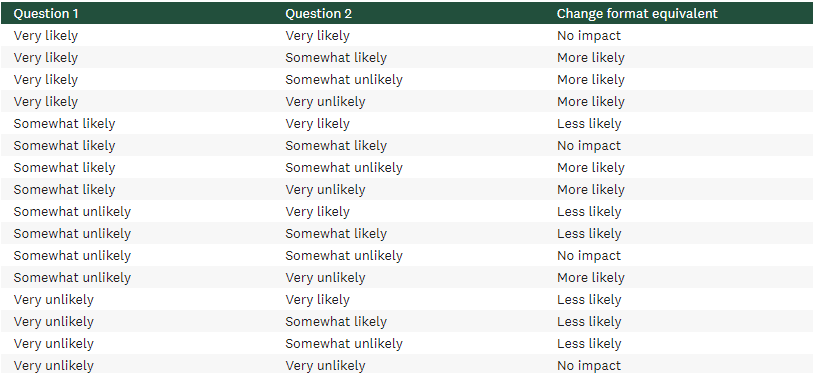
Using this format, you can calculate the percentage of respondents whose response to question 2 was lower on the scale than their response to question 1 – this is the equivalent to the “more likely” group in the change format. For example, if a respondent selected “Very likely” in question 1 and “Somewhat likely” in question 2, that means they were more likely to purchase your product after seeing the commercial. You can do the same thing in the opposite direction to find your “less likely” group. And those who didn’t change their answer are your “no impact” group.
Experimenting with the counterfactual format
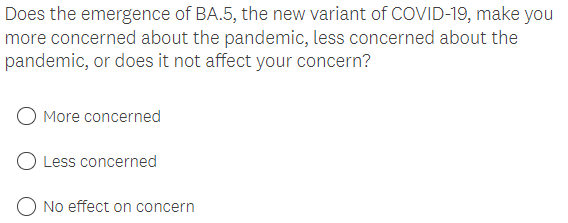
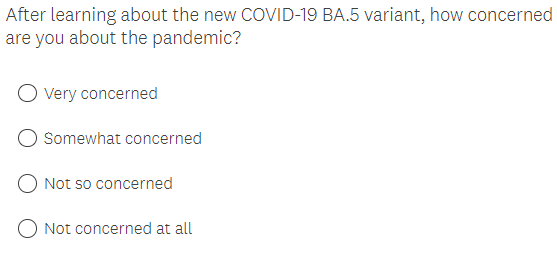
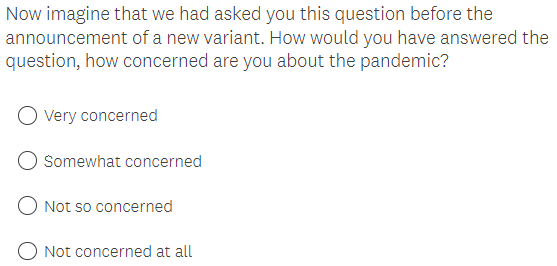
When we wanted to understand how the emergence of a new COVID-19 variant affected levels of concern about the pandemic, we were curious about how the counterfactual format would compare to the traditional change format. Randomly assigning respondents to one format or the other, we asked the following questions:
Change format
Counterfactual format
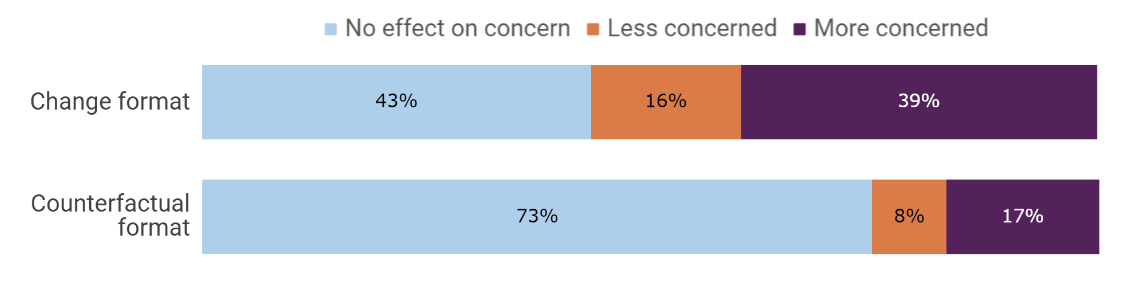
We found that the counterfactual group showed significantly lower rates of attitude change than the change format group, with 73% of the counterfactual group vs. 43% of the change format group showing no effect of the emergence of the BA.5 variant on their concern about COVID. Only 17% of the counterfactual group vs. 39% of the change format group were more concerned about COVID, and 8% of the counterfactual group vs. 16% of the change format group were less concerned.
Along with researchers from Temple and Yale Universities, we tested another version of the counterfactual format in measuring changes in political attitudes and found a similar reduction in attitude change (see Barari, Coppock, Graham, & Padgett, 2023).
The takeaways
The reduction in the magnitude of change for the counterfactual group suggests that the counterfactual format is more accurate than the change format. If we had used the change format alone, we would have overestimated the differences in levels of concern before and after the new variant emerged.
We’ve looked at examples from advertising, public health, and political polling, but these findings are applicable to surveys in any field. The next time you want to know whether an event, a new promotion, an HR decision, or a marketing campaign has changed peoples’ attitudes and opinions, consider trying out the counterfactual format.


