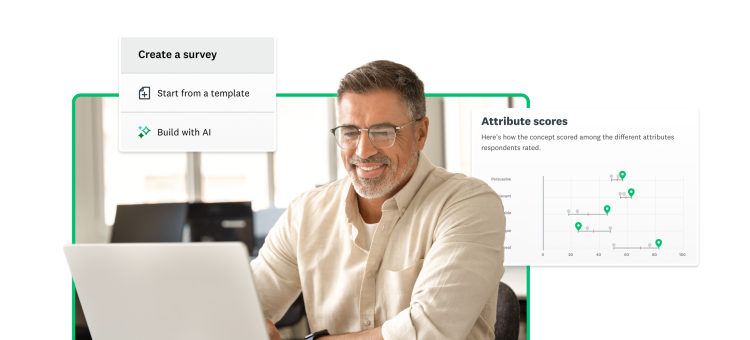
Today we’re announcing 3 new advanced analysis features for our expert solutions for concept and creative testing that will get you to those “aha!” moments even faster.
Earlier this year we introduced a family of 7 expert solutions that provide an easy, powerful way of uncovering insights on your ideas - from product concepts to names, packaging, messaging, and ad/video creative. All of our expert solutions all incorporate our built-in expert methodology and AI-Powered Insights that allow you to make sense of data without doing a single calculation. With expert solutions, you can target your exact audience, launch your study, and receive presentation-ready reports automatically.
And today, the insights you get from our expert solutions are even more powerful. Read on to hear more about:
Start testing your next idea
Give our new expert solutions a test drive.
Cross tabbing to better understand specific audience segments more granular results
At the heart of our expert solutions analysis, you’ll find pre-built scorecards to compare your ideas across a variety of attributes, complete with stat testing and industry benchmarks.
Our new crosstab reports allow you to get even more granular with your results. With crosstab reports, you’ll be able view responses from specific segments or demographics side-by-side in a data table, and have the option to export your data for data visualization.
A cross tabulation or crosstab report shows the answers to each question in your survey segmented by different groups of your respondents - with the most common segments being different demographics. For concept and creative testing, this can be incredibly helpful when you’re trying to see how variations of your idea scored for groups like age, gender, race/ethnicity, income, region, etc. In our crosstab reports, you can see the total number of responses per answer choice, how many times an answer choice was selected, and the percentage of responses that answered–all with statistical testing to indicate whether differences are statistically significant.
Consider this example below:
If you have just finished running a concept test on carbonated drinks and would like to specifically know by age-group, gender and income the frequency that they drank a specific drink, and how they rated your drink bottle packaging ideas. The crosstab report would allow you to gain specific insights across the various age-groups, genders and income levels for each concept that you have tested. The benefit here is that you don’t have to filter and export each view (what a pain!); you can see it all in one condensed report.


New benchmarks for SaaS and Developer Tools
In our expert solutions, benchmarks are an invaluable way to assess how well your concepts match up to the top brands in your industry. With benchmarks, sometimes referred to as “norms”, you can go beyond “which of these 3 ideas is the best?” to “which idea will perform well in the market amidst our competition?”.
Our expert solutions offered benchmarks ranging from arts and entertainment to cleaning products, clothes and accessories, finance and food. Today, we’ve expanded our available benchmarks to include more concept testing attributes and industries.
We’re introducing new benchmarks in the technology sector, specifically around SaaS products and Developer Tools. Perfect for testing ideas in the IT/technology sector, these benchmarks will allow you to compare your results against standards in both those categories.
To generate each of these new benchmarks we tested up to 30 concepts from top companies in those industries based on revenue and sales, using the same methodology as our expert solutions. Our benchmark studies are based on at least 2,000 survey responses per industry, and will be updated periodically over time to keep them current.
See a sampling of some of the benchmark categories we offer below, or contact our team to get a full walkthrough of what’s available.


Coming soon! Advanced filtering for more specific data cuts
We also updated the filtering capabilities in our expert solutions to include more advanced options. This feature now allows you to combine multiple filters with advanced and/or/not/etc. logic to gain laser-sharp insights on the responses received. While having all your results is important for a general, high-level overview, it is equally important to filter and slice those results for a more in-depth view. You may even gain insights that weren’t previously visible in an aggregated view.
Consider this example:
You’ve just run a nationwide survey to test messaging for a new payments app, and would like to view combined results that are filtered by:
- Region: East Coast and West Coast
AND
- Gender: Males and females
AND
- Age-group: 30-44 and 45-60
AND
- Payment Method Preferred: Pay by phone
OR
- Payment Method Preferred: Pay by mail

It is important to note that this new feature now allows you to apply ‘and/or’ logic with the ability to combine it with filters such as ‘is one of, contains or does not contain’ to enable more complex filtering across multiple data segments, thereby simplifying the process of digging for detailed information.
And there you have it! Three new ways to get to more robust insights, faster.
Learn more about our expert solutions in this informative guide.
Note: These new analysis features come with any expert solutions study and are available at no additional cost.
See our expert solutions in action
Watch a 15-minute video demo and see how to get insights on product and creative concepts in as little as an hour.


