In 2022, we saw the continuation of existing trends and the emergence of new ones, from the ongoing impact of COVID-19 to growing concerns about the economy. At SurveyMonkey, we believe that surveys are both a reflection of the past and a predictor of the future. We saw an opportunity to examine data on our own platform to learn more about how society has changed (or not changed) in 2022 and recent years, and to get a glimpse of where it might be heading.
We analyzed all surveys taken on our platform from as far back as 2012, delving into different aspects of our data to gain insight into trends. From looking at how people are taking surveys to exploring the topics being asked about, we were able to uncover three key trends in the world of surveys in 2022: the growing use of mobile survey taking, the rise of non-binary gender answer options, and a focus on important issues from recent years.
1. Mobile device adoption continues to grow among survey-takers
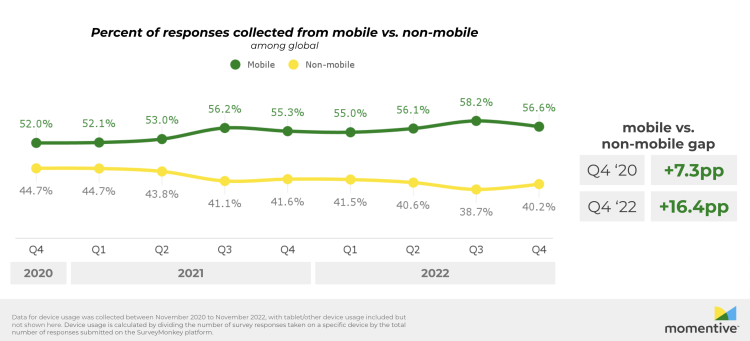
More people than ever before are choosing to use their mobile devices when taking surveys, instead of using non-mobile devices. Surveys taken on mobile devices already well exceed those on non-mobile devices globally, although the US lags behind most of the rest of the world in mobile adoption.
To understand this trend, we analyzed millions of surveys taken on the SurveyMonkey platform and found that 56.6% of all survey respondents in Q4 2022 completed their surveys via mobile devices, compared to 40.2% on non-mobile devices. The gap between mobile and non-mobile usage has widened over the past two years, increasing from a 7-point difference (52.0% mobile vs. 44.7% non-mobile) in Q4 2020, to nearly 16 points (56.6% vs. 40.2%) by the end of 2022.
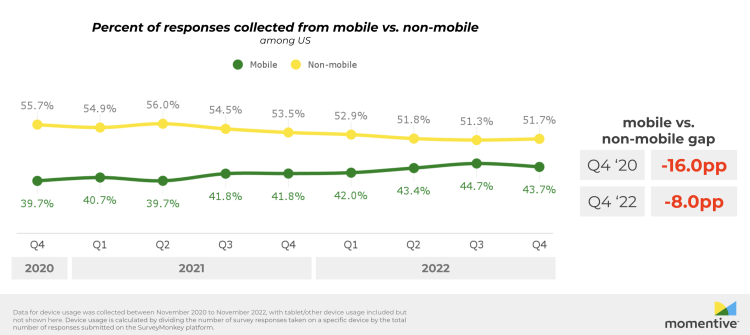
Despite this, the US still has more than half (51.7%) of survey responses coming from non-mobile devices. However, the gap between mobile and non-mobile is closing rapidly.
Below are some helpful resources when it comes to mobile surveys:
2. Surveys are becoming increasingly gender-inclusive
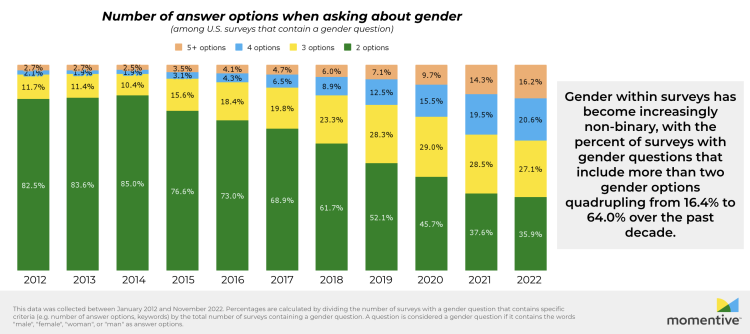
Over the past decade, the way Americans ask about gender in surveys has changed significantly, reflecting larger societal shifts. In 2012, the majority (82.5%) of surveys that asked about gender only provided two answer options (e.g. "male" and "female"), and only 16.4% included three or more answer options. Starting in 2015, however, we see a continuous increase in the percentage of gender questions that include three or more answer options, reaching 64.0% in 2022.
Below are some helpful resources when asking about gender and other demographics:
3. COVID-19 and remote work fade, while diversity, equity and inclusion see staying power in surveys
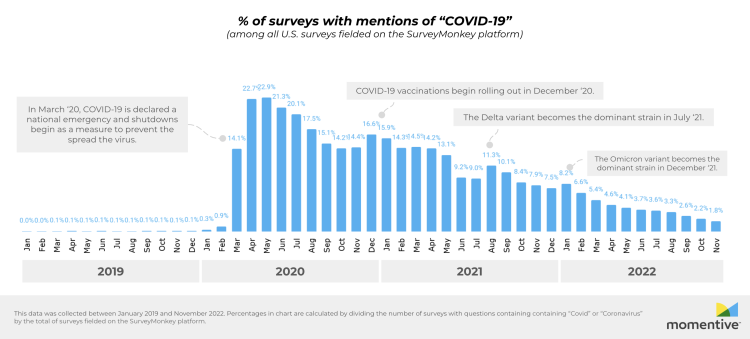
Mentions of “COVID-19”, “COVID”, and “coronavirus” appeared in 14% of all surveys on the SurveyMonkey platform at the beginning of the pandemic in March 2020, and reached a peak of 23% in the following two months that year. Since then, mentions of these key terms have seen only small increases during major events, such as the availability of vaccines in late 2020 and the emergence of new COVID-19 variants (i.e. the Delta variant in July 2021, and the Omicron variant in December 2021). As of November 2022, however, only 2% of all surveys in the US mentioned anything related to COVID.
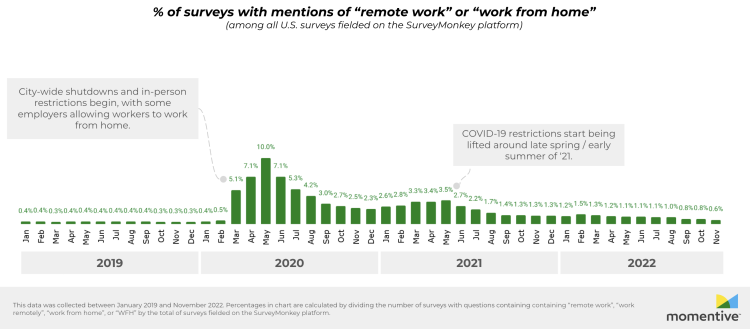
Remote work and return to office have followed a similar trend: 10% of surveys in the US in May 2020 contained terms related to working from home (“remote work,” “work from home,” and “WFH”), and 4% contained terms related to returning to the office (“return to office”). Mentions of both topics declined rapidly before making a slight comeback in May 2021 when restrictions started to ease. By 2022, they largely faded away from surveys, returning to pre-pandemic levels (less than 1% in November 2022 for both “return to office” and “work from home” terms).
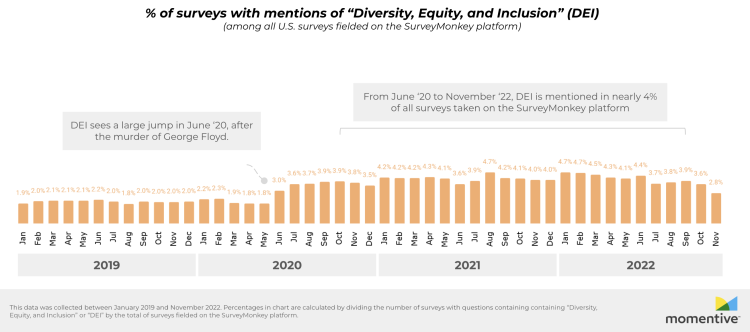
One topic, however, has remained consistently important: diversity, equity and inclusion (DEI). After the murder of George Floyd, mentions of DEI nearly doubled from 1.8% prior to June 2020 to 4% in July and beyond. Since then, mentions of DEI have remained between 4% to 5%, showing no signs of fading away like COVID-19, remote work, and return to office have. The continued relevance of DEI highlights its importance for organizations, teams, and individuals.
Below are some helpful resources related to asking about COVID-19, remote work, and Diversity, Equity, and Inclusion:
COVID-19
Return to office
Diversity, Equity, and Inclusion
4. SurveyMonkey’s most popular template of 2022 helps with event feedback
Top 10 templates in 2022 - global
- General event feedback template
- Customer satisfaction survey template
- Employee engagement survey template
- Volunteer feedback template
- Meeting feedback survey template
- Customer feedback survey template (B2B)
- Net Promoter Score (NPS®) template
- Event planning template
- Contact information template
- Professional event feedback template
From measuring customer satisfaction to gathering event feedback, a wide range of SurveyMonkey templates were heavily used in 2022. Our “General event feedback” template was the most popular globally, slightly ahead of the “Customer satisfaction” and “Employee engagement” templates.
Top 10 templates in 2022 - US
- General event feedback template
- Employee engagement survey template
- Meeting feedback survey template
- Customer satisfaction survey template
- Volunteer feedback template
- Event planning template
- Net Promoter Score (NPS®) template
- Contact information template
- Training course evaluation template
- 360-degree employee evaluation template
In the US, the rankings for template usage were similar to the global rankings, with “General event feedback” coming in first, followed by “Employee engagement” and “Meeting feedback”. Templates focused on customer feedback, such as the Customer satisfaction and Net Promoter Score® (NPS®) templates, also performed well.
Top 10 templates in 2022 - UK
- General event feedback template
- Volunteer feedback template
- Customer satisfaction survey template
- Employee engagement survey template
- Net Promoter Score (NPS®) template
- Meeting feedback survey template
- Name testing template
- Neighborhood feedback survey
- Event planning template
- Customer feedback survey template (B2B)
In the UK, the “General event feedback” template was most popular, followed by “Volunteer feedback” and “Customer satisfaction” templates.
Curious about our templates? Browse our survey templates by category here!
Methodology:
Rise of mobile: Device usage is calculated by dividing the number of survey responses taken on a specific device by the total number of responses submitted on the SurveyMonkey platform. Data for device usage was collected between November 2020 to November 2022.
Gender inclusion: Percentages are calculated by dividing the number of surveys with a gender question that contains specific criteria (e.g. number of answer options, keywords) by the total number of surveys containing a gender question. A question is considered a gender question if it contains the words "male", "female", "woman", or "man" as answer options. This data was collected between January 2012 and November 2022.
Key trends: Percentages are calculated by dividing the number of surveys with questions containing specific keywords by the total number of surveys fielded on the SurveyMonkey platform. This data was collected between January 2019 and November 2022.
Templates: Rankings are based on the number of times a template has been deployed in a survey in 2022. This data was collected from January 2022 to November 2022, and only templates shown on SurveyMonkey.com were included in the rankings.


