How to use a Top 2 Box score in your survey analysis

How likely are prospects to purchase your products? Are your customers satisfied? And is your brand appealing?
Each of these questions is likely to elicit a range of answers, which complicates your ability to interpret their responses. To cut through the clutter of your response data, consider using a Top 2 Box score—a survey analysis technique that lets you highlight key values in an easily digestible way.
We’ll discuss how a Top 2 Box score helps your survey analysis. In addition, we’ll walk through the various forms that it comes in. That way, next time you’re writing your questions or reviewing survey responses, you can leverage your knowledge of a Top 2 Box score to get the most out of your survey.
But first, what exactly is a Top 2 Box score?
Defining the Top 2 Box score
A Top 2 Box score (sometimes called T2B) is a way of summarizing the positive responses from a Likert scale survey question. It combines the highest 2 responses of the scale to create a single number. Given its simple calculation and the value it brings to your survey analysis, Top 2 Box scores are used in a variety of ways within market research. The list includes anything from ad testing and product development to brand tracking.
To help you understand the process of calculating a Top 2 Box score more concretely, let’s walk through an example.
How to calculate a Top 2 Box score
Let’s assume you’re a marketer at a pet food company. You want to test a couple of advertising ideas with your target market—pet owners. In your survey, you’d be looking to understand how likely—or unlikely—pet owners are to purchase your product after seeing an ad.
To get an answer, you use the following 5-point scale purchase intent question:
If the product were available today, how likely would you be to buy it?
- Extremely likely
- Very likely
- Somewhat likely
- Not so likely
- Not at all likely
Once you’ve collected survey responses, the data might look like this:
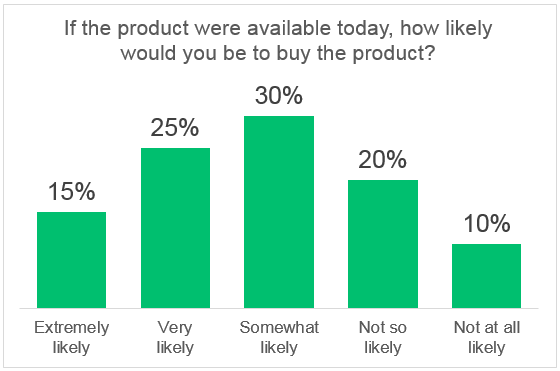
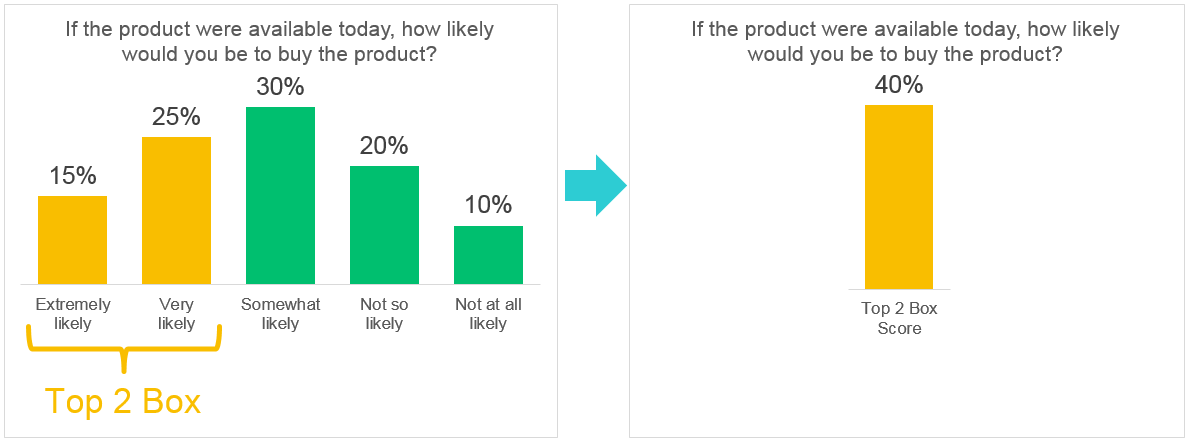
As a marketer, you’re most likely interested in finding the percentage of people who are likely to purchase your product after seeing the ad. So in this example, the Top 2 Box responses are the first two positive responses: Extremely likely and Very likely. To calculate the Top 2 Box score, you just add together both of these responses:
15% (Extremely likely) + 25% (Very likely) = 40% (Top 2 Box)
Pro tip: In SurveyMonkey Analyze, you can easily create a Top 2 Box score by combining answer choices.
Now that you know how to calculate a Top 2 Box score, let’s talk about the reasons for using it.
Why use Top 2 Box scores?
1) It simplifies your analysis. Instead of reviewing 5+ numbers, you’ll only have 1 to look at.
2) Comparisons are quick and easy. Whether you’re comparing results across brands or stimuli (e.g. when testing concepts), Top 2 Box scores allow you to compare results side-by-side more efficiently.
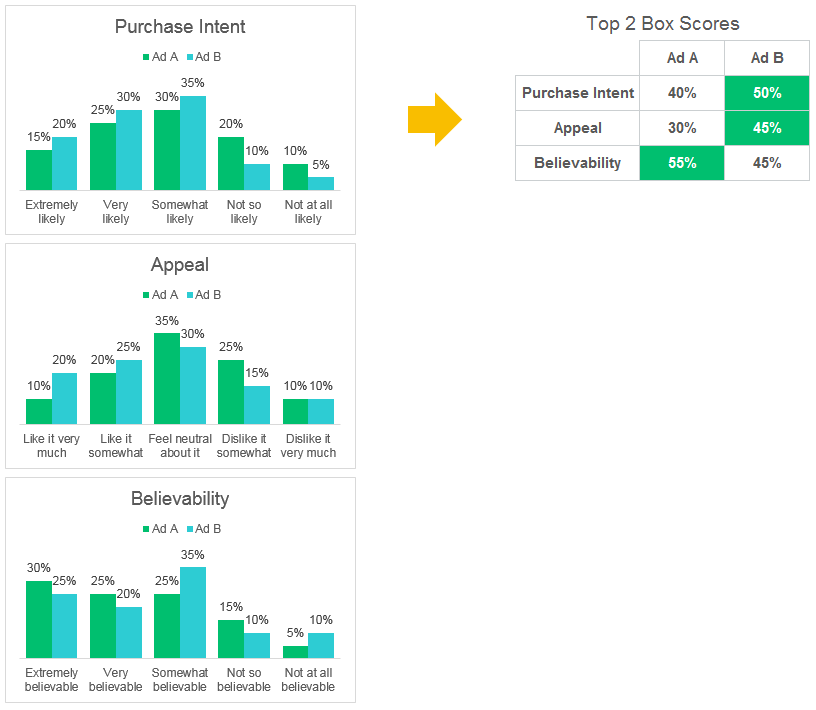
Let’s revisit our earlier example of the pet food company. Imagine you asked not only purchase intent questions, but also appeal and believability questions. With Top 2 Box scores, you can say goodbye to an abundance of charts that are difficult to interpret, and say hello to clean, simple scorecards.
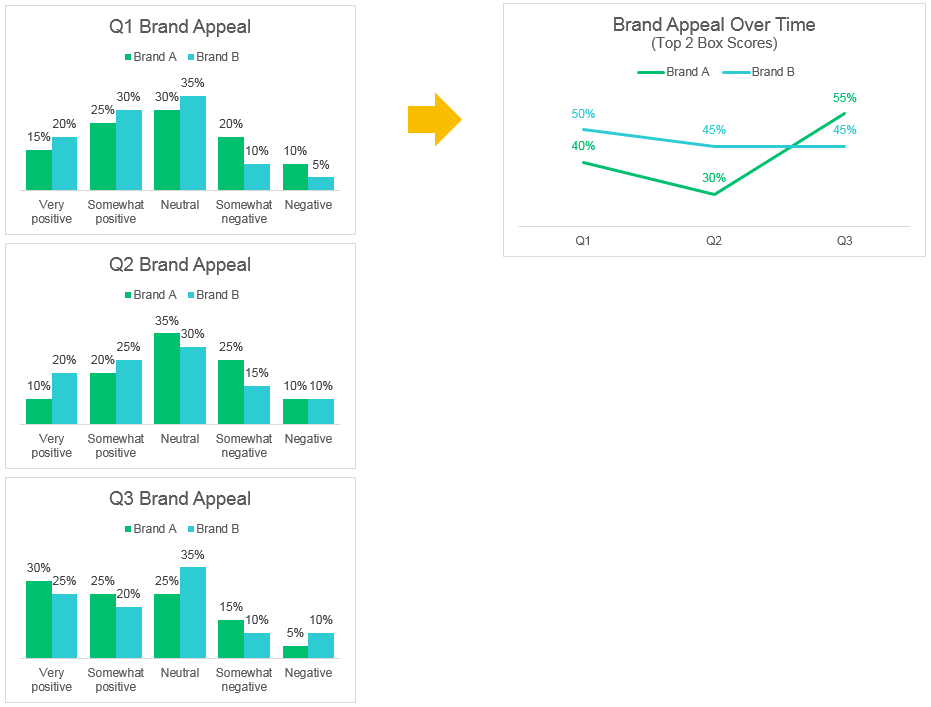
3) Trends become easier to spot. When tracking metrics over time, Top 2 Box scores help you identify trends in your data.
For example, let’s say you’re tracking the brand appeal of your own brand versus your top competitor. You use a 5-point scale question that measures the relative perception of each brand. As you track the results on a quarterly basis, you view how each brand is trending, side-by-side.
Top 2 Box scores allow you to capture your analysis over a period of time using a single visual.
Ready to test your gut instincts?
SurveyMonkey Audience has consumers around the world who will tell you what they think.
Variations of Top 2 Box scores
There are several variations of Top 2 Box scores. Here are some of their most common forms:
Top Box score
Use a Top Box score when you’re just interested in the top box. For example, if you’re looking to improve customer retention and plan to use a star-rating question to measure customer satisfaction, you may be more interested in increasing the % of customers who give you 5 stars over time.
How would you rate our services?
- ★★★★★
- ★★★★
- ★★★
- ★★
- ★
To calculate the Top Box score, simply find the percentage of respondents who select the top choice. So if 20% of your respondents select 5 stars, your Top Box score would simply be 20%.
Top 3 Box score
Use a Top 3 Box score for Likert scale questions that go beyond a 5 point scale. The calculation is similar to the Top 2 Box, only you add together the top 3 positive responses.
How satisfied or dissatisfied were you with the customer service you received?
- Extremely satisfied
- Very satisfied
- Satisfied
- Neutral
- Dissatisfied
- Very dissatisfied
- Extremely dissatisfied
Bottom 2 Box score
When you’re looking to aggregate the negative responses from a Likert scale question, you might use a Bottom 2 Box instead of a Top 2 Box. For example, take this brand loyalty question from our brand conversion survey template:
How likely are you to switch to another brand for your next purchase?
- Extremely likely
- Very likely
- Somewhat likely
- Not so likely
- Not at all likely
To create a metric that quantifies your loyal customers, use a Bottom 2 Box score. It simply involves adding the bottom 2 responses (“Not so likely” and “Not at all likely”) together.
Weighted Top 2 Box score
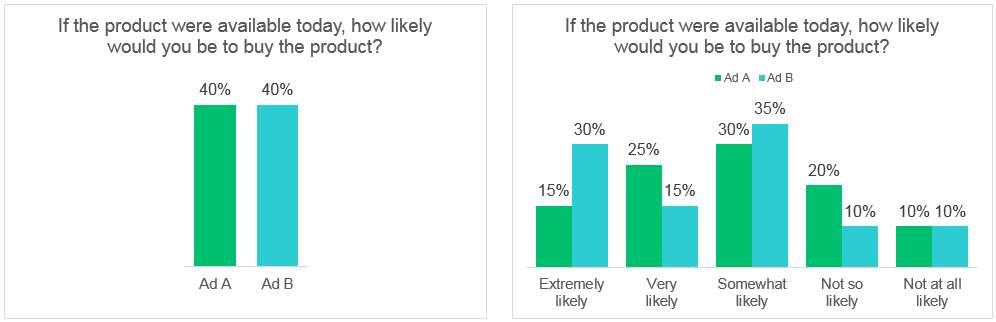
Occasionally, you want to dive deeper into the Top 2 Box. Consider the breakdown of the following Top 2 Box scores on a purchase intent question for two different product concepts:
Product A
Top 2 Box score: 40%
Extremely likely to purchase: 15%
Very likely to purchase: 25%
Product B
Top 2 Box score: 40%
Extremely likely to purchase: 30%
Very likely to purchase: 10%
In this case, the Top 2 Box scores of the two products are the same, so you might draw the same conclusion. However, Product B has double the responses for “Extremely likely to purchase”, giving it a significantly higher purchase intent than Product A.
This example shows you can’t always rely on the aggregate Top 2 Box score in isolation, especially when comparisons are close in magnitude. Using a weighted Top 2 Box score (or a single Top Box score) can provide more clarity and help you avoid needing to retest the ads or refield for a higher sample size.
How to calculate a weighted Top 2 Box score
A weighted Top 2 Box score is calculated as follows:
(Top box score * Top box weight) + (Second box score * Second box weight) = Weighted Top 2 Box score
The somewhat subjective piece of the equation are the weights themselves. Some rules of thumb when determining weights for Top 2 Box scores are:
- The top and second box weights can’t be the same
- The two weights should add up to 1
- The weight of the top box is typically greater than the weight of the second box. This is because the top box of an ordinal Likert scale question type is typically the most extreme positive answer—which better predicts market performance
- When deciding on weights, the product category and level of consumer decision making should be taken into account. When products are more affordable and easier to buy (e.g. toothpaste), consumers are better at giving accurate survey answers, so you can give the Top Box a higher weight. When buying products require more thought (e.g. buying a car), give the Top Box only a slightly higher weight.
Top 2 Box scores are essential for any market researcher. Whether you’ve collected results related to ad testing, product feedback, or brand awareness, Top 2 Box scores will improve the efficiency of your survey analysis and help you make the right decisions.
Discover more resources

Toolkits directory
Discover our toolkits, designed to help you leverage feedback in your role or industry.

Five integrations to help you discover new insights
Integrate survey data into your most-used apps to get more insights from your feedback.

Likert scale examples, survey questions, and common mistakes to avoid
Explore Likert scale questions, examples, and common pitfalls to avoid in your next survey.

Make every survey count: how to increase your reach and collect better data
Learn how to send your survey to maximize survey responses and get more from your insights.