What is a Likert scale?
Learn about one of the most reliable ways to measure opinions, perceptions, and behaviors and how you can use it in your next survey.

Likert scales are a structured way for researchers to gather diverse opinions and attitudes. They allow respondents to express agreement, disagreement, or neutrality concerning statements or questions.
Named after Rensis Likert, these scales are widely used in disciplines such as psychology, sociology, and market research to quantify qualitative data effectively.
Let’s explore what makes up a Likert question, including examples, when you should use Likert scales, and how you can use them in your surveys.
What is a Likert Scale?
To understand the Likert rating scale, you first need to understand what a survey scale is.
A survey scale represents a set of answer options—either numeric or verbal—that cover a range of opinions on a topic. It’s always part of a closed-ended question (a question that presents respondents with pre-populated answer choices).
A Likert scale is a rating scale used to measure survey participants' opinions, attitudes, motivations, and more. It uses a range of answer options ranging from one extreme attitude to another, sometimes including a moderate or neutral option. However, 4- to 7-point scales are the most popular..
So, what is a Likert scale survey question? Instead of asking a yes/no question like, "Do you like our product?", respondents rate their attitudes on a scale ranging from "don’t like at all" to "like it a lot."
Using Likert scales, researchers and practitioners can effectively quantify and capture the complexity of individual opinions, psychology, and attitudes. For instance, someone who "likes the product but is not crazy about it" would probably give a Likert rating of "somewhat like it."
Why are Likert scales important?

Likert scales (named after their creator, American social scientist Rensis Likert) are quite popular because they are one of the most reliable ways to measure opinions, perceptions, and behaviors.
Likert scales are easy to design and can be used for various topics and quantitative surveys.
Compared to binary questions, which give you only two answer options, Likert-type questions will get you more granular feedback about whether your product was just “good enough” or (hopefully) “excellent.”
This method will let you uncover degrees of opinion that could make a real difference in understanding the feedback you’re getting. It can also pinpoint areas where you might want to improve your customer or employee experience.
Using the same Likert scales in longitudinal or recurring surveys can also track seasonal changes in customer attitudes. For example, you can send a quarterly survey to assess customer loyalty to your brand. With those data, you can see the quarterly and yearly changes in customer loyalty. This will help you understand your current and past brand health and, most importantly, predict how it may trend.
What are Likert scale questions?
Likert scale surveys can come in many forms. Here are a few of the most commonly used question types.
Likelihood: How likely a respondent is to take a particular action, like signing up for a membership or purchasing a product. These questions are good if you’re trying to determine how likely someone is to do something instead of just how much they like the idea of something.
Satisfaction: How satisfied are your customers with something your company offers or does? Asking satisfaction questions is a great way to figure that out.
Importance: To gauge how strongly people feel about a certain service, product, or experience, you can ask a Likert scale question that measures how important something is to a customer.
Likert scales are very flexible rating scales and you can adjust the scale points easily to fit your survey design. Some of the common are 4-point, 5-point, 7-point, and 10-point scales.
4-point Likert scale
The 4-point Likert scale usually does not provide the middle or neutral points of the scale. This is typically used to make sure that respondents provide an attitude. An example of a 4-point Likert scale could look like this:
How satisfied or dissatisfied are you with the speed of product delivery?
- Very dissatisfied
- Dissatisfied
- Satisfied
- Very satisfied
5-point Likert scale
The 5-point Likert scale uses five answer options, including a midpoint or neutral option, to assess a respondent’s opinions. A typical 5-point Likert scale example looks like this:
How easy or difficult is it to sign up for our mobile app?
- Very difficult
- Somewhat difficult
- Neither difficult nor easy
- Somewhat easy
- Very easy
6-point Likert scale
The 6-point Likert scale is similar to a 4-point one but offers more options to respondents. The following example demonstrates what a 6-point Likert scale may look like:
How important or unimportant is using social media to you?
- Very unimportant
- Unimportant
- Somewhat unimportant
- Somewhat important
- Important
- Very important
7-point Likert scale
The 7-point Likert scale offers more response options to your survey takers to get a more nuanced data set. A sample 7-point Likert scale survey could look like this:
How much do you agree or disagree that the company helps its employees grow their careers?
- Strongly disagree
- disagree
- Somewhat disagree
- Neither agree nor disagree
- Somewhat agree
- Agree
- Strongly agree
10-point Likert scale
The 10-point Likert scale provides 10 choices to survey respondents, allowing you to get data with more granularity and precision. The following is an example of a 10-point scale:
How important or unimportant is it for you to talk about your career growth regularly with your manager?
- 1 = Very unimportant
- 2
- 3
- 4
- 5 = Neither important nor unimportant
- 6
- 7
- 8
- 9
- 10 = Extremely important
The Net Promoter Score® (NPS) is a famous Likert scale question commonly used to measure customer satisfaction and brand loyalty. It uses an 11-point Likert scale from 0 to 10. The NPS survey question differs from other scales as it uses a numerical scale rather than verbal descriptors.
Frequency Likert scale
Frequency is a common measurement for Likert scales in quantitative surveys. It is used for collecting self-reported frequency of a behavior, such as using or purchasing your product, engaging in team-building activities etc. Here’s an example of a frequency Likert scale:
In general, how often do you shop in our store?
- Always
- Often
- Sometimes
- Rarely
- Never
Is a Likert scale ordinal?
Yes, a Likert scale is ordinal. The intervals between the values your respondents can choose are not truly equal, and so can’t be considered a set of quantitative intervals.

Get opinions from the market with our online survey panel
Pros and cons of Likert scales
Pro: Likert scale questions improve data quality
Likert scales capture attitudes or opinions more precisely than binary questions. For example, customers who “like the product, but are not crazy about it” can give either a “yes” or “no” answer to the binary question of “Do you like our product?” making it nearly impossible to understand the degree of preference for the product.
Likert scale questions, by comparison, improve survey data quality by allowing more accurate and nuanced answers from survey takers.
Pro: Likert scales work better when questions focus on one topic
It’s important to keep each series of questions in your survey focused on the same topic. In the end, this will help you get more accurate results. Why? Because when the time comes for you to report the data, you want to analyze a score that summarizes the results from a few questions.
For example, you could ask this initial question:
- How satisfied or dissatisfied are you with the quality of the dinner you were served tonight?
And follow up with:
- How satisfied or dissatisfied are you with the quality of your appetizers tonight?
- How satisfied or dissatisfied are you with the quality of the main course tonight?
- How satisfied or dissatisfied are you with the quality of the desert tonight?
But here’s one question you should leave for another section of the survey:
- How satisfied or dissatisfied are you with the service at the coat-check room tonight?
Grouping questions about one topic together and adding up their responses to get a score–a “Quality-of-Food” score, in this case—will give you a more reliable measurement of attitudes toward the particular product, service, or event you’re researching.
Pro: Likert scales keep respondents happy
Likert scales are easier for survey-takers to understand and respond to than open-ended, ranking, or “select all” questions. Therefore, respondents are less likely to experience survey fatigue and get frustrated in their survey-taking process. They will have a positive survey experience and be willing to provide their feedback again in your future surveys.
Con: Likert scales lack the “why”
Likert scales will provide you insights into how your customers, employees, or target market think about your product, company, or service, but they do not tell you why they think so. For example, you may find out that your customers are not satisfied with your mobile app with Likert scales, but the scales don’t suggest how to change your mobile app to improve customer satisfaction.
Carefully planning the survey design will help address the “why.” For example, after you ask participants to rate their satisfaction on Likert scales, follow up with a multiple-choice or an open-ended question to inquire about the reasons they provide those ratings. Combining Likert scales with follow-up questions will give you a full picture of customer insights.
Con: Likert scale responses are subjective
The interpretation of Likert scale points can vary between respondents. Individuals also think of the extremity of their opinions and attitudes differently. One person’s “strongly agree” might be another’s “somewhat agree.”
To mitigate the potential subjectivity issue, researchers or practitioners must make sure they choose Likert scales with the right number of scale points. More scale points could mean more nuances in data and insights, but having too many scale points also increases potential ambiguity between answer options.
Con: Neutral Likert scale responses may skew data
In some survey topics, survey takers might intentionally choose the neutral point in Likert scales to avoid being perceived as having extremist views. For example, suppose a customer is rating different aspects of your product, service, or business on a Likert scale of 1 to 10. In that case, most of the answers will fall in the center (4-7), with only a few being rated highly (8-10) or lower (1-3).
Making sure that respondents know the survey is anonymous can help. Knowing when to introduce a neutral or midpoint option is also crucial, and it depends on the specific question being asked.
For instance, this structure recognizes the possibility that individuals may genuinely feel neutral about the experience:
Would you say that the experience had a positive or negative impact?
- Very positive
- Somewhat positive
- Neither positive nor negative
- Somewhat negative
- Very negative
When to use a Likert scale questionnaire (survey examples and use cases)
Net Promoter Score® (NPS)
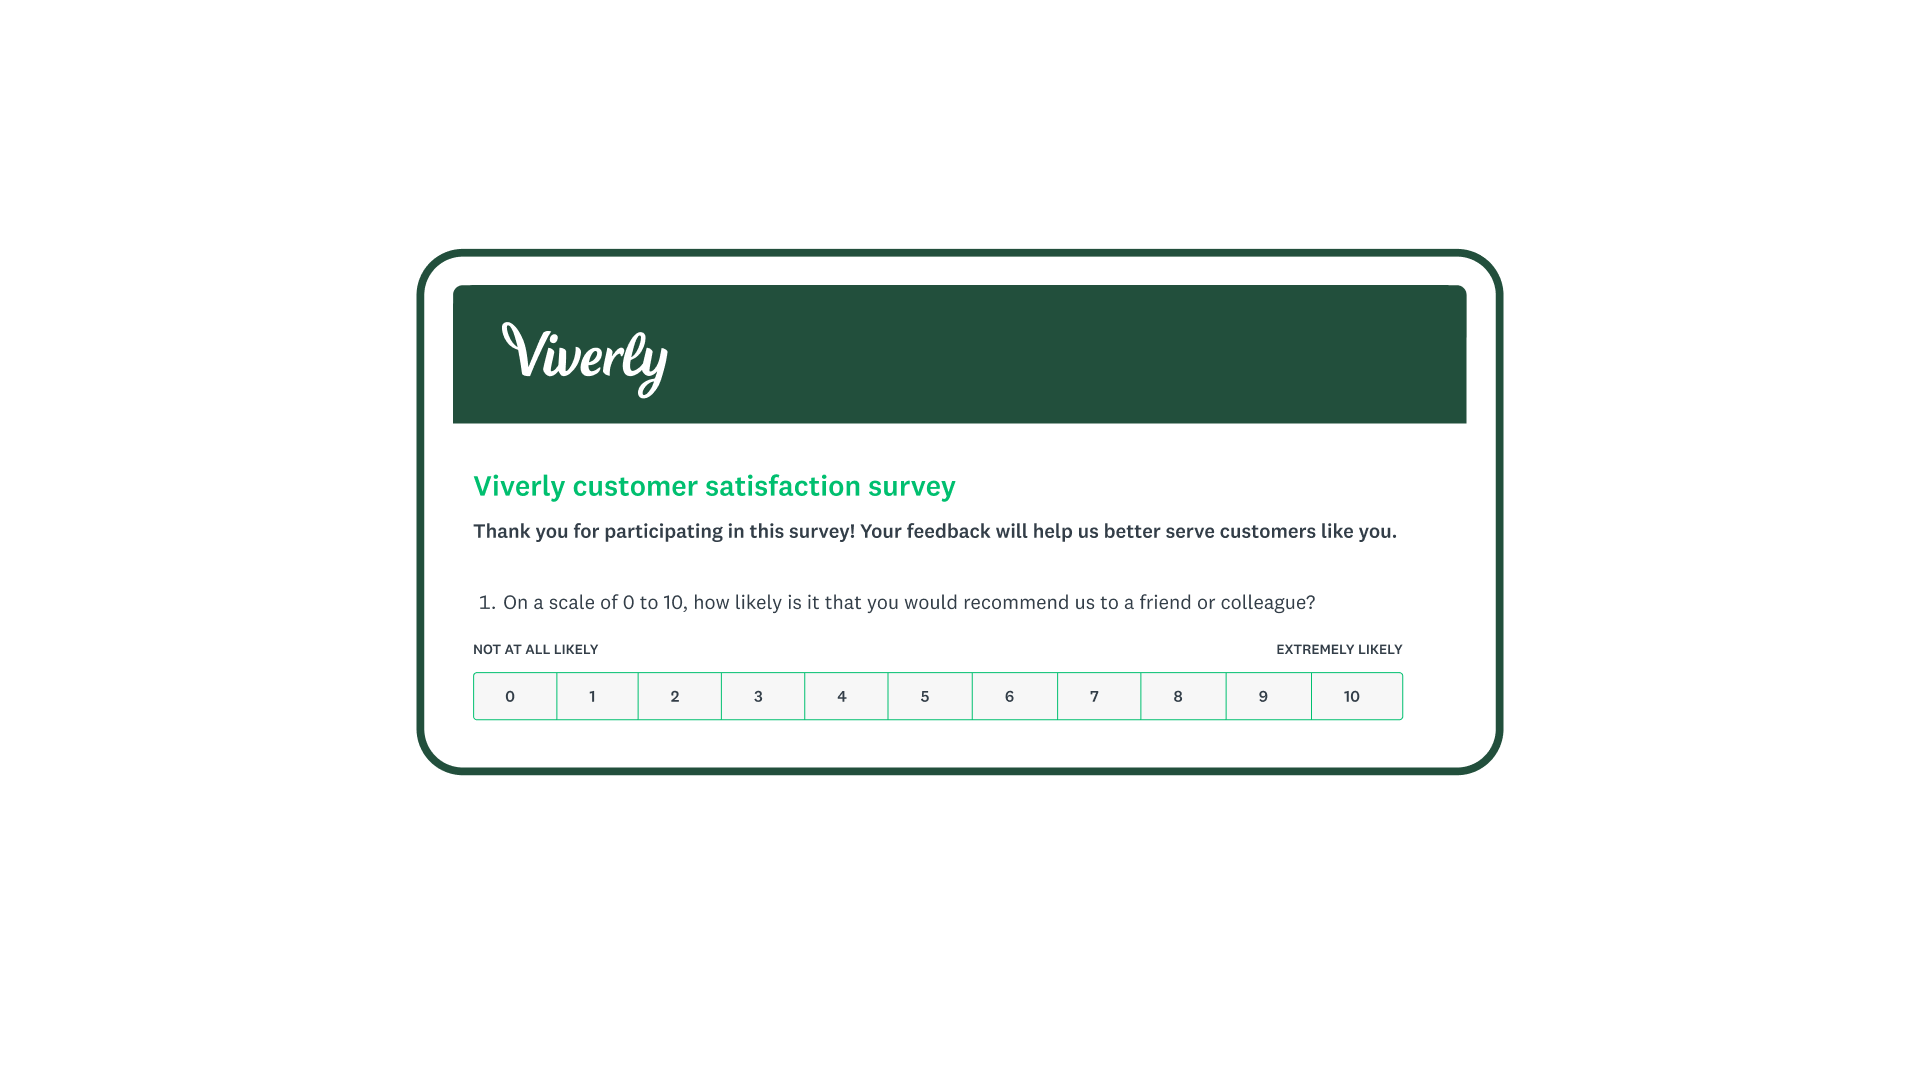
Net Promoter Score is a highly regarded loyalty metric companies use to collect customer feedback. An NPS survey is simple to create. It asks respondents to rate the question, “How likely is it that you would recommend this company to a friend or colleague?” on a 0 to 10 Likert scale.
The answers customers provide are classified as follows:
- Detractors (0–6): Unhappy customers who can hurt your brand through negative word-of-mouth
- Passives (7–8): Satisfied but indifferent customers who the competition could sway
- Promoters (9–10): Loyal customers who will keep buying and referring others
Related reading: Everything you need to know about the NPS® survey question
Customer Satisfaction Score (CSAT)

Customer Satisfaction Score measures customer satisfaction with your products, services, or business. Typically, CSAT surveys ask customers about their satisfaction levels on a Likert scale. Below is an example of a customer satisfaction Likert-type scale on “satisfaction”:
How satisfied or dissatisfied are you with the speed of checking out on our website?
- Very dissatisfied
- Somewhat dissatisfied
- Neither satisfied nor dissatisfied
- Somewhat satisfied
- Very satisfied
Related reading: Customer satisfaction surveys: Examples and tips for getting started
employee Net Promoter Score (eNPS)
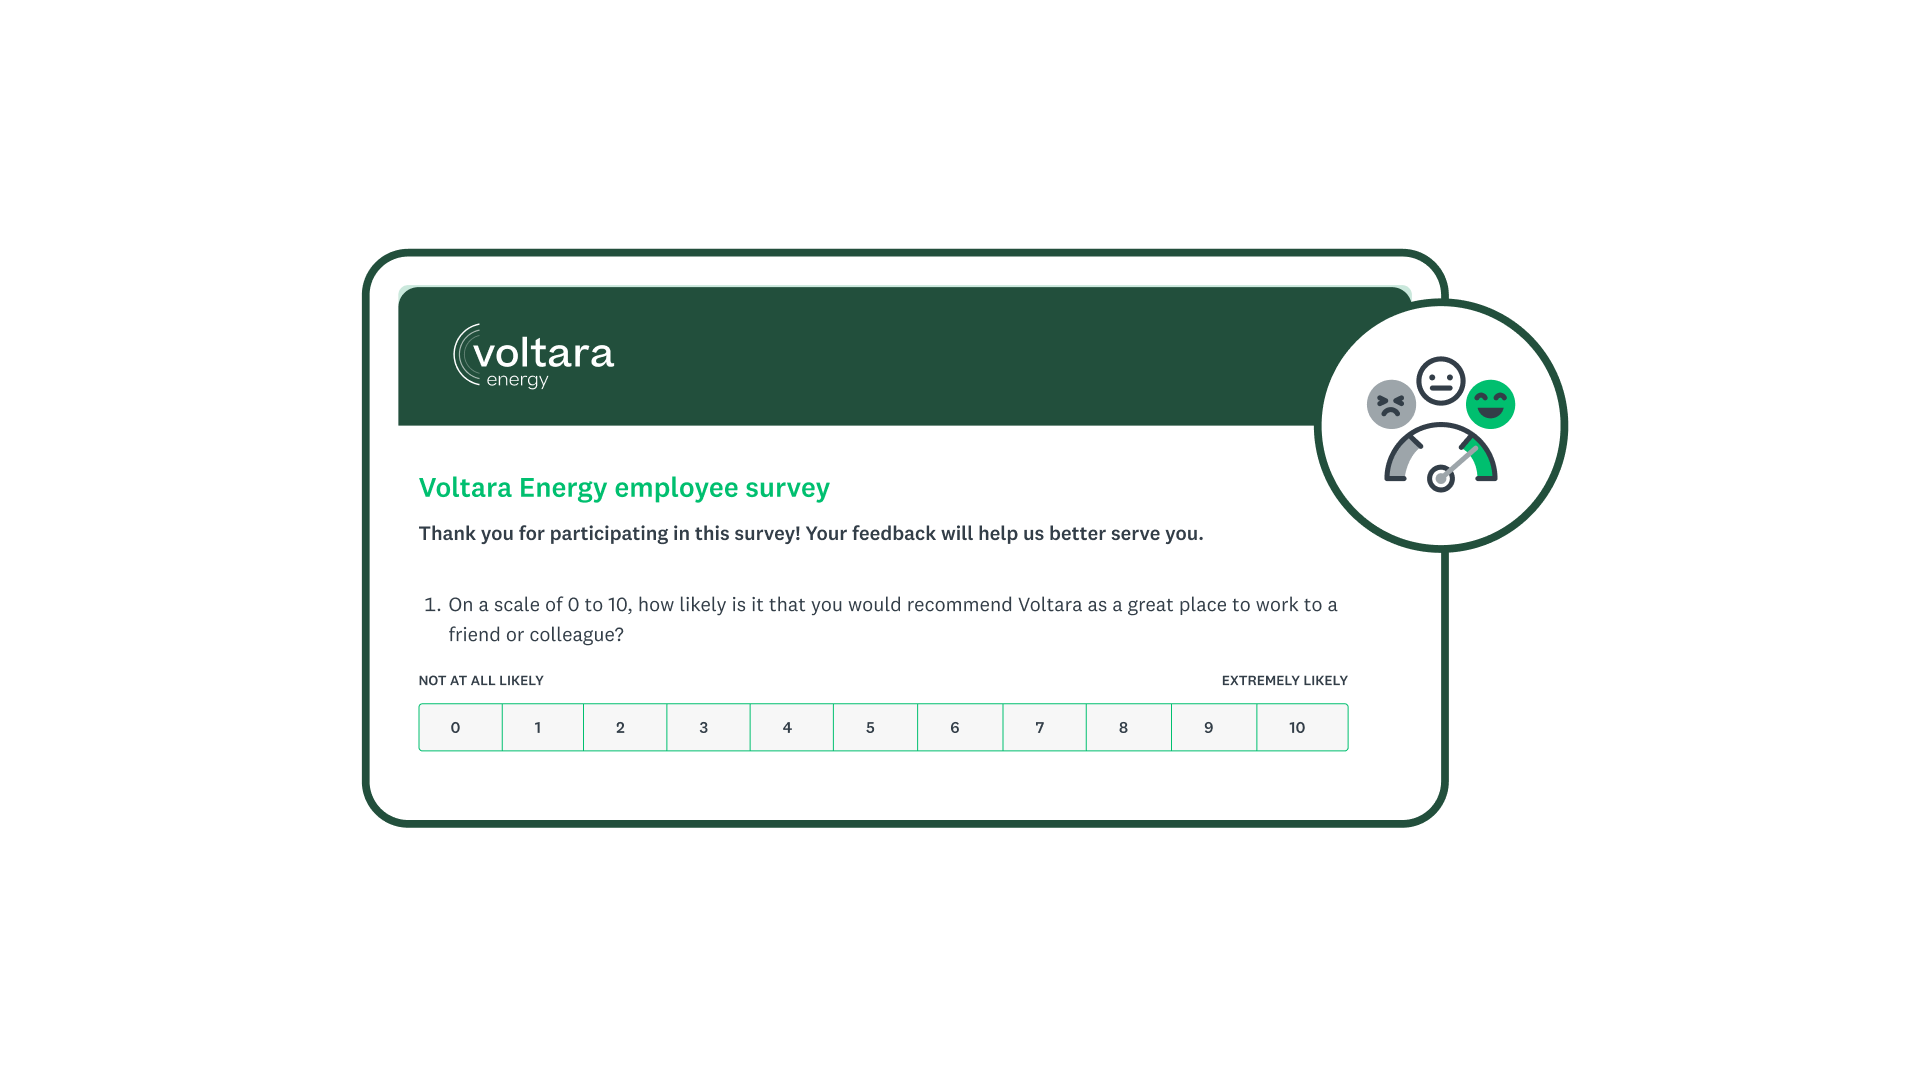
Similar to NPS, the employee Net Promoter Score measures employees’ sentiment and loyalty towards the employer. Employees are asked a single question: “On a scale of 0 to 10, how likely is it that you would recommend working at this company to a friend or colleague?"
Similarly, employees’ answers can be classified as follows:
- Detractors (0–6): Unhappy employees who are unlikely to recommend the company and can result in turnover and negative word-of-mouth
- Passives (7–8): Satisfied but indifferent employees who are not enthusiastic about the workplace
- Promoters (9–10): Loyal employees who are your company's best advocates
Related reading: What is employee Net Promoter Score®?
Employee engagement survey
An employee engagement survey measures how committed employees are to the mission and goals of your company. Insights from the survey can indicate the health of the business. You can stay informed about how employees feel about life at your company by using Likert scale surveys. This could fall into various issues, such as employee training, career development, new policies, etc.
How satisfied or dissatisfied are you with the training opportunities provided by our company?
- Very dissatisfied
- Somewhat dissatisfied
- Neither satisfied nor dissatisfied
- Somewhat satisfied
- Very satisfied
Event feedback
After an event, you can use Likert scales to gather feedback from your attendees to evaluate the success of the event. Regardless of whether the event is in-person or online, you can use event feedback surveys to understand participants’ overall experience and their sentiments about different aspects of the event. For example:
How helpful or unhelpful was the event in connecting you with people with similar interests?
- Very unhelpful
- Somewhat unhelpful
- Neither helpful nor unhelpful
- Somewhat helpful
- Very helpful
Related reading: The ultimate guide to event surveys
Website feedback
Learning how easy to use and enjoyable your prospects and customers find your website is a great reason to create a survey. You want to be sure that you’re presenting your company and products in the best way possible and providing a great user experience. A Likert scale survey question to gather website feedback from your site visitors could look like this:
How likely or unlikely are you to return to our website to find information?
- Very unlikely
- Somewhat unlikely
- Neither likely nor unlikely
- Somewhat likely
- Very likely
Customer information
Knowing more about your customers and their habits is always helpful. It is vital for your marketing and product teams so they can tailor ads and new items to exactly what your customers want. Asking them Likert survey questions can help you get a deeper understanding of their opinions and preferences. A survey question to gather opinions from your customers might look like this:
How important or unimportant to you is attractive packaging?
- Extremely unimportant
- Somewhat unimportant
- Neither important nor unimportant
- Somewhat important
- Extremely important

Take the legwork out of Likert scale questions
SurveyMonkey Genius helps you quickly build surveys with more confidence—just choose an answer type to automatically add a set of prewritten answer choices to your question.
How to write Likert scale survey questions and responses
1. Determine survey scale
Like we mentioned above, Likert scales are flexible. You don’t have to use a fixed survey design. Instead, you can determine how many scale points to use in your survey.
There are many factors to consider when making a decision. Likert scales with fewer scale points are easier for respondents to read and process but will not provide as many details and nuances.
Likert scales with more scale points give you more detailed data, but you will sacrifice some response time. They can make your respondents feel fatigued fast. They worsen the subjective interpretation of scale points too.
You will also need to decide whether to use an odd-numbered or even-numbered scale too. If making sure that survey takers provide attitudes is important to your project, then you may consider taking out the middle-point or the neutral point of the Likert scale and use an even-numbered one.
Ultimately, you will need to consider your research priorities and weigh the factors accordingly.
2. Write accurate questions
To maximize their effectiveness, Likert-type questions need precise phrasing.
For instance, when asking about satisfaction with restaurant service, it's crucial to specify which aspect of service is being referred to – valets, waiters, or hosts. You also need to be clear about the aspects of service you want to evaluate, such as the speed, courtesy, or quality of food and drinks.
Being more specific in Likert scales will get you more valuable responses.
3. Opt for clear responses
When crafting Likert scales, make sure respondents understand your intent clearly. Use descriptive words in response options to avoid confusion about relative rankings.
- Start with extreme terms like "extremely" and "not at all"
- Place the midpoint for moderation or neutrality
- Use clear terms like "very" or "slightly" for remaining options
This approach helps respondents navigate the scale effectively.
4. Choose bipolar or unipolar options
Bipolar constructs are those where attitudes can fall on one side or the other of a midpoint that itself is true ambivalence or neutrality. Unipolar constructs are those that lend themselves strictly to an amount and don't have a neutral midpoint–either there is the maximum amount of the attitude or none of it.
For instance, let’s say I asked you to rate how helpful this article is. It may fall between being the most helpful article you’ve ever read and not helpful at all. From there, we can safely assume there is something in between–like “sort of” helpful. This is an example of a unipolar construct.
5. Use questions, not statements
Statements pose a risk: most people tend to agree rather than disagree. This is because survey respondents tend to select positive response options more frequently (known as agreement or acquiescence response bias). Therefore, asking a question is more effective than making a statement.
How to analyze Likert scale data
Once you’ve created your Likert scale survey, most of your hard work is done! However, you still need to analyze the data you receive from the survey responses to measure your performance in your survey target area.
Since Likert scales are ordinal scales, Likert scale analysis is best summarized using a median or a mode. Means/averages are not always useful.
When analyzing Likert scale data, you want to look at the distribution of responses across scale points or categories. You can summarize the percentages of each response category and then visualize the results using bar graphs.
Depending on the goal of your project, you can also merge Likert scale points into simpler categories. For example, suppose you gathered customer satisfaction on a 5-point Likert scale ranging from “not at all satisfied” to “highly satisfied.” In that case, you may want to get the total number of respondents who gave a “somewhat satisfied” or “highly satisfied” answer. This will tell your team the total number or percentage of people with a positive sentiment. The treatment of NPS data is also an example of categorizing scale points.
Remember, while analyzing your Likert survey data, despite it being a very accurate way of gathering data, it’s still susceptible to social desirability bias. That means people are likely to give answers they think are socially acceptable instead of being honest, especially with difficult questions. They may choose to answer as undecided or neutral options instead of their real preferences.
6 Likert scale best practices & tips to get started
By now, you must be an expert in using Likert scales. Here are six tips to help you become even more proficient.
- Keep it consistent. Once you decide on the Likert scale design, such as scale length, bipolar vs. unipolar, and whether to use neutral options, keep it consistent throughout the survey. Consistency across a survey is a best practice.
- Keep it specific. Instead of "agree/disagree," use context-specific response options (such as satisfied/dissatisfied) that match the question's wording.
- Keep it labeled. Avoid using numbers. Numbers can cause respondents to infer additional information about the scale that the survey maker may not have intended.
- Keep it continuous. Response options in a scale should be equally spaced from each other. This can be tricky when using word labels instead of numbers, so make sure you know what your words mean.
- Keep it inclusive. Scales should span the entire range of possible responses. If a question asks how quick your waiter was and the answers range from “extremely quick” to “moderately quick,” respondents who think the waiter was slow won’t know what answer to choose.
- Keep it logical. Add skip logic to save your survey takers time. For example, let’s say you want to ask how much your patron enjoyed your restaurant, but you only want more details if they were unhappy. Use question logic so that only those who are unhappy skip to a question asking for improvement suggestions.
Design a Likert scale survey
Customizing a Likert rating scale in your next survey will give you the best possible insights. Learn more about SurveyMonkey plans or create a free account.
Net Promoter, Net Promoter Score, and NPS are trademarks of Satmetrix Systems, Inc., Bain & Company, Inc., and Fred Reichheld.
Discover more resources

Toolkits directory
Discover our toolkits, designed to help you leverage feedback in your role or industry.

Power your business with online order forms
Easily build and customize order forms and receive payments for your goods and services or use one of our expert-built templates to get started in minutes.

Five integrations to help you discover new insights
Integrate survey data into your most-used apps to get more insights from your feedback.

Likert scale examples, survey questions, and common mistakes to avoid
Explore Likert scale questions, examples, and common pitfalls to avoid in your next survey.
Create and send a survey for free in minutes
Use SurveyMonkey's survey templates and get the feedback you need.