
If you’ve collected insights before, then you know that making sense of responses to your open-ended questions is challenging. More than 40% of SurveyMonkey surveys include open-ended questions. We recommend them because text responses often show you a more complete picture of your customers, employees, or prospects.
Analyzing this type of qualitative data can even be laborious for advanced market research firms. It involves reading the results, searching for keywords, and organizing responses in a way that allows you to make quantitative claims.
SurveyMonkey Analyze features—such as filtering, cross-tabulating and benchmarking—help distill the results of your closed-ended questions. But if you need to hear your respondents’ opinions in their own words, there hasn’t been a quick and easy way to analyze open-ended, text responses—until now.
Save time analyzing your open-ended questions
Imagine not having to read through hundreds of text responses to understand what respondents said. This is now possible with the roll out of Sentiment Analysis, available on SurveyMonkey Premier, Team Premier, and Enterprise plans.
Sentiment Analysis uses machine learning and natural language processing (NLP) to save you time. It reads through the responses to your open-ended questions and categorizes each response as positive, neutral, or negative. Then, it shows you the distribution of these categories for any open-ended question, helping you understand how your respondents feel.
Let’s take a look at how it works. From October 2018 through January 2019, we conducted a brand awareness survey for the sparkling water category. We reached out to more than 2,300 respondents using SurveyMonkey Audience in hopes to learn more about how people perceive sparkling water brands such as La Croix, Spindrift, San Pellegrino, and Schweppes.
We asked respondents what adjectives they would use to describe the sparkling water brands, then used Sentiment Analysis to determine if the overall sentiment was positive or negative. Words like “refreshing,” “bubbly,” and “tasty” were analyzed as positive sentiments. Words like “dry,” “unpleasant,” and “mediocre” were bucketed as negative sentiments.
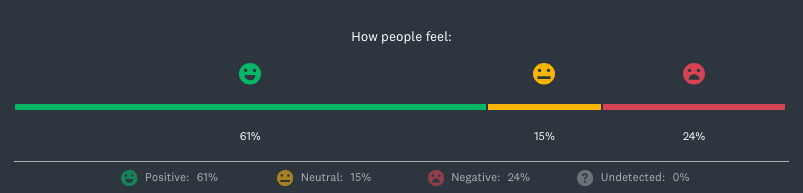
We found that 61% of respondents felt positive about Spindrift, with only 24% feeling negative about the brand.

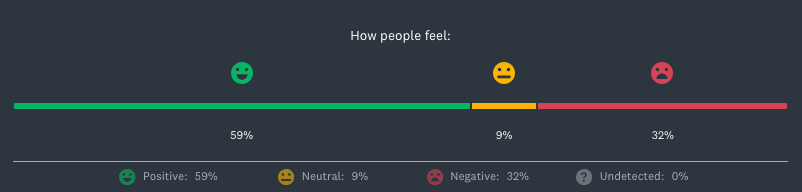
When asked the same question about San Pellegrino, we found that 59% of respondents also felt positive, but 32% actually felt negative.

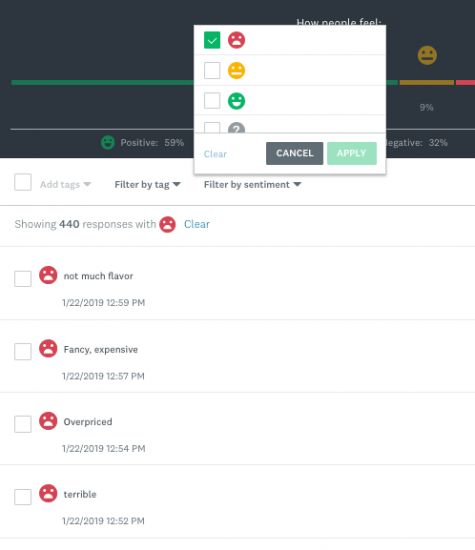
You can also filter by sentiment to dig deeper into those responses. What questions received the most positive responses? Why did the end of the survey result in more negativity from respondents? Did one group of respondents feel differently than the others? By looking at sentiment holistically, the results may surprise you.
When we filtered questions about San Pellegrino by negative sentiment, we found a lot of similarities in the responses. Respondents tended to feel that the brand was more costly than the other brands.
Get colorful visualizations of text responses
Sentiment Analysis is just one way to analyze responses in SurveyMonkey. We’ve enhanced our Word Cloud feature, which is another powerful way to get insights from your open-ended questions.
Word Cloud will count frequently used words in your text responses and visually present them, making it easier to look for trends. You can pair it with Sentiment Analysis and filter by sentiment. For example, filter for positive sentiments on one particular question and the cloud will populate the frequently used words within those parameters so you can learn what respondents liked.
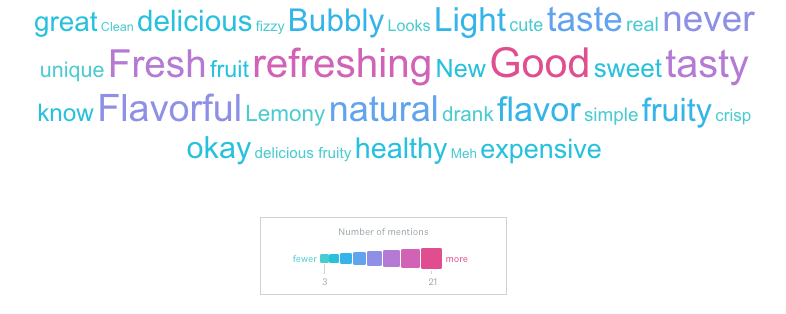
In our sparkling water survey, we wanted to know why people might be choosing Spindrift over San Pellegrino, or the other brands. Word Cloud helped us easily analyze more than 1,500 text responses, highlighting the words respondents frequently used to describe the brands.
For Spindrift, words like “good” and “refreshing” were used more than 20 times. Other words used to describe Spindrift included “fruity” and “flavorful.”
Spindrift
When we analyzed San Pellegrino, we found that respondents felt the brand was more upscale than the others. For example, the words “expensive” and “fancy” were mentioned more than 100 times. Other words associated with San Pellegrino include “Italian” and “crisp.”
San Pellegrino
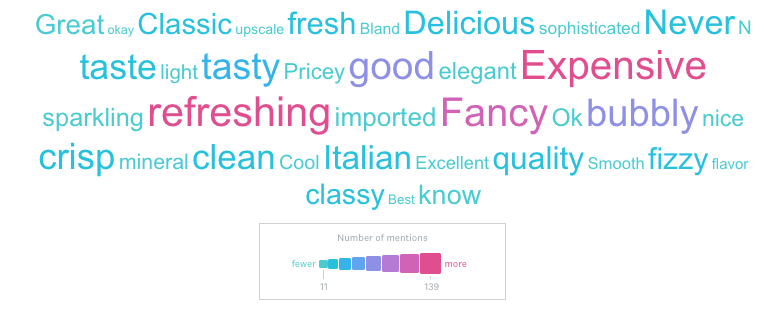
We’ve even added a scale at the bottom of the word clouds to help with data visualization. For San Pellegrino, the least common word shows up 11 times and the most common word shows up 139 times.
Word Cloud can now process more than 5,000 open-ended responses, saving you the hassle of searching for frequently used words in your results. The machine learning technology is so advanced that it can understand the rules of grammar like plural vs. singular words, present and past tense, abbreviations—even emojis!
You can get creative when you use the Word Cloud. With some paid plans, you can customize its color and font, and set minimum/maximum controls for words and frequency. These additional customizations make Word Cloud look great in presentation decks when you want to share text analysis with stakeholders.
Sentiment Analysis and Word Cloud are useful features for analyzing the text responses in any kind of survey. Use them to analyze brand awareness surveys as we did with sparkling water brands. Or, leverage them on your Customer Satisfaction, Employee Engagement, or Post-Event surveys to find out where you shine or fall short.
This SurveyMonkey Audience study was conducted from October 2018 to January 2019. We surveyed 2,381 adults, 18 and older, who live in the U.S. The sample was balanced by age and gender according to the U.S. Census. This study was conducted independently by SurveyMonkey. The brands mentioned in this article did not commission the study.


