How to start benchmarking
Use our survey templates to compare your results with industry averages
What is SurveyMonkey Benchmarks?
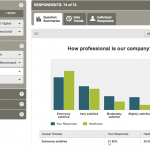
When you use SurveyMonkey Benchmarks, you’re comparing your survey results against average results (benchmarks) from other SurveyMonkey customers or organizations similar to yours. Why? Your survey results become more meaningful and actionable when you get to see them in context:

After you collect survey responses, you can see them alongside average scores by industry type—just like in the example above.
Types of available benchmarks
See how you stack up against similar organizations in many areas—including customer satisfaction, employee engagement, and website feedback—when you send our benchmarkable, pre-written survey templates from your SurveyMonkey account.
It’s important to note that, while you don’t have to use every question in one of our templates, the more benchmarkable questions you use, the more comparisons you’ll see in your results.
And although some questions have a customization option, beyond that, it’s best if you leave the questions as is. If you alter these standard, expert-certified questions, we’ll be unable to provide benchmarks.
Available survey templates:
Customer satisfaction template
Net Promoter Score℠ (NPS) survey template
Website feedback survey template
K-12 parent engagement survey template
Employee engagement survey template
Event feedback survey template
Net Promoter and NPS are registered service marks of Bain & Company, Inc., Satmetrix Systems, Inc. and Fred Reichheld
Where do SurveyMonkey Benchmarks come from?
Over time, our customers have sent millions of our expert-certified surveys and Question Bank questions to employees, customers, student parents, and event attendees, just to name a few. We’ve aggregated and anonymized those survey responses in order to calculate a benchmark for each survey question by:
- Finding an average response for each individual survey
- Adding up those individual scores to generate an average across all surveys
If you opt in to SurveyMonkey Benchmarks, we collect profile information about your organization used to categorize your survey’s responses into comparison groups based on factors like industry, size, and location. That way, we can provide more targeted benchmarks.
How we ensure data quality
We only include data from surveys deployed in the last four full quarters to adjust for seasonality and to keep our data fresh and relevant. To maintain the integrity of our data, we also exclude responses from surveys with less than five responses per question.
The data for our benchmarks are updated quarterly. Updated (and newly available) SurveyMonkey Benchmarks are published early January, April, June, and September—and become accessible in your account the same day they’re published.
Your data privacy
Nothing that identifies you or your survey respondents are visible in the statistics or benchmarks we display to others. When you create a survey, all of your responses are aggregated and anonymized.
To preserve anonymity, we enforce rules that require a minimum of at least 10 organizations to be included in a published benchmark. And only responses you collect from Question Bank questions are included in our benchmarking data—none of your custom-created questions are included.
If you have additional questions about how we handle your personal information and data, please see our Privacy Policy.
Discover more resources

Toolkits directory
Discover our toolkits, designed to help you leverage feedback in your role or industry.

You asked, we built it: Announcing our new multi-survey analysis feature
New multi-survey analysis from SurveyMonkey allows users to combine and analyze survey results into one single view.

Presidential debate 2024: How political debates impact public opinion
Reactions to the presidential debate were quick and decisive. New research on what people think and who will be the most influenced

What is a questionnaire? Definition, examples, and uses
Learn how to use questionnaires to collect data to be used in market research for your business. We share examples, templates, and use cases.