The ultimate guide to running a customer feedback program


Jon Gitlin
Content Strategist
Learn every step of running a customer feedback program using surveys—from organizing your team and designing your survey to analyzing your responses and taking action.
Table of contents
────


01 Overview
Everything you need to know before getting started
Ensuring that your customers are happy and engaged is critical to the success of your business.
There are countless statistics that back this claim:
- It’s up to 25 times more expensive to acquire a new customer than retain an existing one.
- The probability of successfully selling more to current customers is at least 3 times higher than it is to sell to prospects.
- Improving your retention rate by 5% can boost your bottom line by as much as 95%.
The question is how to help your customers be successful so that they continue to use your product/service and buy more from you.
The answer: Build a customer feedback program—a centralized, systematic way to collect the voices and opinions of customers throughout the customer journey (in our case, using surveys), which, if acted on, delivers clients products and services that truly meet their needs.
Why a customer feedback program matters
Having a team focused on customer feedback may seem like a luxury, but you can build a Voice of the Customer strategy using limited resources. Moreover, practically any company can benefit from a centralized, systematized method of listening to customers. Why?
You know that each of your customers is unique—whether it’s in the types of products/services they use, how they use them, or who within the company uses them. Couple these differences with the fact that your customers are made up of a diverse group of people, and you’ll find that there’s no one-size-fits-all solution that supports each of their preferences and needs.
Think about your own customers. Do you know the following with absolute confidence?
- How each customer feels about using your product/service
- Whether each customer will buy from you again
- How much better (or worse) each customer’s experience with your company has been during the past 6 months
According to McKinsey, measuring customer sentiment throughout the customer lifecycle is 30% more predictive of clients’ overall satisfaction than evaluating how they feel at a single point in time. Surveys are perfect for this because they give customers a quick, convenient way to provide candid and thoughtful feedback, and require little effort to send multiple times to even very large groups of people (more about this in the “Sending” section).
Once you understand the customer experience in more detail, you’ll be able to take steps that deliver clients more value. For example, you’ll be able to train customer-facing employees in the areas they need to improve on most; and you’ll be in a position to adjust your product roadmap to better meet the needs and wants of your customers.
And eventually, you’ll experience big business improvements:
What you’ll get out of this guide
We’ll walk through each step of building your own customer feedback program (using surveys) with expert guidance from SurveyMonkey's Voice of Customer team.
To help make our tips more relatable to your company’s situation, we’ll review, throughout the guide, how two types of organizations approach each step of building their own customer feedback program:
- A scrappy startup that’s determined to improve customer retention. They’re particularly focused on retaining the few Fortune 500 customers they have, as they pay the most.
- A bigger, more established business looking to deliver customers more value so they can increase the number of upsell (selling customers a more advanced version of what they already have) and cross-sell (selling customers other types of products/services) opportunities.
Choose the version that makes the most sense for your organization, and we’ll walk you through the process step-by-step.
Let’s begin with the most fundamental step: planning your customer feedback program.
Quick note: We’ll be talking about the Net Promoter Score® (NPS) in the coming section. If you’re unfamiliar with the term, it’s considered the world’s leading metric for measuring customer happiness and loyalty. And since it’s a foundational element of a customer feedback program, you’ll see it mentioned throughout this guide. If you want more context on the NPS, you can find an in-depth breakdown about it in the Design section!
If you’re interested in measuring customer satisfaction using another question, like the customer effort score, you’ll still be able to apply this guide’s framework for building your customer feedback program.
Net Promoter, Net Promoter System, Net Promoter Score, NPS and the NPS-related emoticons are registered trademarks of Bain & Company, Inc., Fred Reichheld and Satmetrix Systems, Inc.
02 Project planning
Building your Voice of the Customer strategy from the ground up
Building an effective, centralized, and systematic customer feedback program from scratch isn’t a simple task. In order for your program to be effective, it must hold a central role in your company and wield enough influence to deliver insights and recommendations to teams that can put them to use.
That means you need goals, a strategy, partnership with key teams in your organization, and the blessing of your company’s leadership to build a truly effective customer feedback program.
In this chapter, we’ll walk you through how to plan a customer feedback program that:
- Meets your company’s needs
- Matches your available resources
- Uses the most appropriate NPS survey
Identify a goal that matches your company’s needs
If you’re going to justify the need for a customer feedback program, you should come up with a goal for your program that aligns with the goals of your company. It’s best to come up with a clear, attainable goal for your program before you do anything else. That way, it’s easier to zero in on focused questions that deliver actionable insights that will inform your goals.
To land on the right goal, you’ll need to assess the current challenges your organization faces. Then, reverse engineer those challenges into a clear-cut, realistic goal for your program. Here are some example scenarios, along with goals that match them:
You see that customers churn at a high rate.
Goal: Understand why customers are churning so you can take steps that will reduce the churn rate by 3% per quarter.
You’re looking to gain a competitive advantage, so you need to offer a top-notch customer experience in your industry.
Goal: Achieve a relatively high NPS in your industry. This involves either using a competitive NPS survey to know what your rivals’ scores are, or using an industry-wide benchmark (if it’s available) to see where you stand.
You need to ensure that you don’t lose sight of your customers as your company grows.
Goal: To consistently improve your customers’ experience, you aim to increase the NPS of customers who’ve been with you for over 6 months by 3 points per quarter.
Keep in mind that if your goal is too generic, it’s likely to be less attainable and not provide enough direction. And if it’s too specific? It may not make enough of an impact to justify a centralized customer feedback program.
Here are some goals that don’t work—with the first goal being too general and the second being too specific:
- “We want to substantially increase our NPS.”
- “We want to increase our NPS by 2 points per quarter, among customers based out of Northern California, that have partnered with us for more than 3 years.”
Gauge your internal resources
Maybe running a customer feedback program is your full-time job; for most, it’s only one of several things you do. Either way, you’ve got to be realistic about the time and resources you have available and what effect you can really have. The impact you can make depends entirely on the size of your company, your customer base, and the resources you can put towards the program.
If you’re at a scrappy startup, there’s a good chance you’ve got several responsibilities in addition to your customer feedback program. And even if you don’t, there’s a good chance you don’t have a lot of time, which means you need to be super strategic with how you use it. You’re going to need to identify a goal and develop a strategy that’s lightweight enough for you to handle on your own. A scrappy startup should prioritize a single, attainable goal that’s absolutely vital to its success.
If you’re at a more established company, you’ve likely accumulated a larger customer base, and built a more diverse and specialized set of teams. All this is to say, things aren’t necessarily going to be easier. You’re going to want a more holistic customer feedback strategy that focuses on more than one area or challenge of your business.
1. Find partners who can benefit from your work
The best thing about customer feedback programs is that the information you get from them can benefit practically every team in your organization. Here are just a few examples of the ways a well-run customer feedback program can help lift your entire organization up.
2. Get buy-in from your leadership
If your executives don’t consider your program to be mission-critical, you won’t get the resourcing you need to ensure its success.
To help leadership understand why your program matters, you’ll need to speak their language. You should already have an attainable goal that’s tied to your organization’s priorities, and a plan for how your program can benefit teams across your company.
Here are some customer feedback proof points that align with common program goals. Share these as part of your pitch to leadership, but if possible, complement them with research that’s specific to your industry. The more relevant your data is, the better it will resonate with colleagues.
Goal #1: Reduce customer churn
- 87% of customers who have a very good customer experience are likely to return.
- 33% of customers would think about churning after a single case of poor service.
Goal #2: Boost sales
- Customers are willing to spend 17% more, on average, for great customer service.
- What customers say about your product/service can influence 20-50% of prospects’ buying decisions.
Goal #3: Stay relevant in increasingly competitive market
- A customer is four times more likely to switch to a competitor if the problem they're having is service-based
- According to customers, only 8% of the organizations they work with deliver a great customer experience. This means you can enjoy a competitive advantage if you provide a valuable experience.
When our Voice of the Customer team first began creating a customer feedback program, the team knew that doing so would allow us to better understand our customers and take steps to improve the customer experience. To get buy-in, they presented leadership with an NPS program that used persuasive research by Bain, including the fact that an NPS industry leader outgrows competitors by more than 2x. Though leadership was already keen on running a more robust NPS program, the research created urgency in getting the program up and running faster.
Over time, our Voice of the Customer team has been able to use our own survey data to show happier customers do, in fact, churn at a lower rate than unhappy customers. This has given the program even more credibility with executives and has allowed it to become an increasingly visible and important part of employees’ day-to-day work.
Choose which Net Promoter Score survey you’ll adopt
Now that you have your team together and the executives are bought in, you can choose the type of NPS survey to use.
But first, some background on the Net Promoter Score: The score is derived from the Net Promoter Score question, which asks, “How likely would you be to recommend [Company name] to a friend or colleague?” The respondent is then asked to give a rating on a scale between 0 (least likely to recommend) and 10 (most likely to recommend).
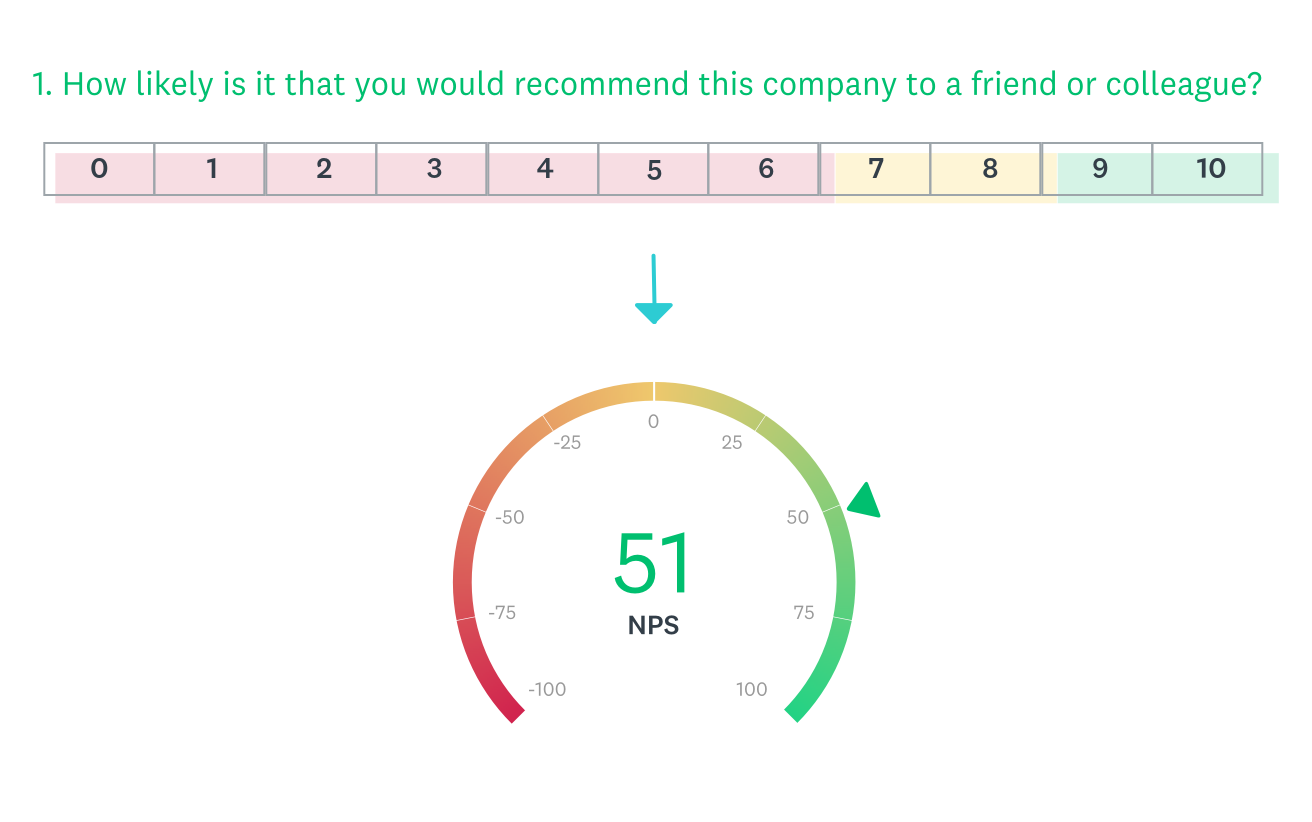
Your customers are grouped into cohorts based on their scores:
- Detractors selected a rating between 0 and 6. Think of them as your most dissatisfied customers who are at risk of leaving you.
- Passives picked a 7 or 8 rating. They’re relatively satisfied from working with you, but can be influenced to switch over to a competitor based on factors like price or the quality of your customer support.
- Promoters chose a 9 or 10 rating. As your happiest and most loyal group of customers, they’re not only likely to buy from you again, but are also willing to recommend you to others.
To calculate your NPS, take your percentage of Promoters and subtract it by your percentage of Detractors. To put it in its equation form:
NPS = % of Promoters – % of Detractors
Calculate your NPS in a matter of clicks with our free NPS calculator.
NPS surveys can be divided into three groups: relational, transactional, and competitive. They each have distinct purposes, designs, and sending styles. Here’s a look at each of them:
Transactional NPS surveys
Transactional NPS surveys are sent to customers following a defined action, and ask them to evaluate a specific experience. You can use this survey for anything, from following up on a phone call with a support representative, to getting feedback from a webinar your team hosted.
A transactional NPS survey aims to understand a specific part of the customer experience. And pinpoint how, exactly, that experience is performing over time.
SurveyMonkey uses transactional surveys at different stages of the customer engagement. For example, when the customer is using the product, they can click a button to provide feedback via a survey. The survey they receive depends on whether they’re in the process of creating a survey, setting up their collector (how they’ll gather their responses), or analyzing their feedback.
Try a transactional NPS survey if you…
- Want feedback you can act on, immediately
- Hope to get concrete feedback on specific aspects of the customer experience
- Are looking to evaluate the relative performance of different products/services, offices, or even individuals in similar roles
But don’t use it when you…
- Are looking for a holistic understanding of the customer experience
- Want to compare your NPS with competitors’
- Already have a lot of customer-facing surveys (adding too many NPS surveys to the mix can wear out respondents and diminish your response rate on future surveys)
Relational NPS surveys
Relational NPS surveys consistently collect feedback from a sample of customers (who can be chosen at random but shouldn’t include any one customer more than once per quarter) to get a holistic understanding of the experience. They can be sent to a fraction of customers on a weekly, monthly, or less frequent cadence. While relational surveys themselves may be low effort, keep in mind that certain parts of your program, like follow-ups with individual customers and the quality of your reporting, can demand the most time and resources from your team.
A relational NPS survey aims to understand the overall customer experience. So it tends to focus on broader topics, like the customer’s level of satisfaction and the general quality of your product/service.
Use a relational NPS survey when you want to…
- Understand how key aspects of your product/service are generally performing
- Measure changes in the customer experience over time or across different segments
- Focus on making high-level, strategic decisions
And avoid it when you’re looking to…
- Identify or address specific customer issues immediately
- Gauge the impact of specific customer-focused initiatives
- Understand the performance of specific customer-facing employees
- Continue using a lot of other customer-facing surveys (adding a relational NPS survey can lead to respondent burnout and lower your response rate on future surveys)
Pro tip: Don’t try to launch transactional and relational NPS survey projects at the same time. Instead, choose one to get started with. Once the first survey is running smoothly, you can carry your learnings over to the next NPS survey.
Competitive NPS surveys
Competitive NPS surveys involve getting feedback, anonymously, on you and your competitors from people in your target market (individuals who match the criteria of your ideal customers). Collecting the feedback anonymously limits bias in your responses—allowing you to accurately evaluate how you stack up against the competition. Similarly, surveying the wider market, and not just your own customers, helps you get a fair assessment on where you stand.
Note: This survey template only allows the respondent to evaluate a single competitor. If you’d like the respondent to potentially evaluate an additional competitor, copy page 2 of the survey and edit that page’s copy with the brand’s name (you can repeat this process for however many brands you want to add). Finally, to ensure that respondents only evaluate the competitors they use, incorporate skip logic on question 3.
Use this type of NPS survey to…
- Identify who your biggest competitors are
- Learn what the market likes and dislikes
- Discover your strengths and weaknesses relative to competitors
But keep in mind that…
- Surveying people who aren’t in your customer base costs money
- The opinions on competitors and on your own business may change more quickly than your rate of sending surveys (making your survey data potentially less useful if it isn’t acted on promptly)
With these 3 types of NPS surveys in mind, which would our scrappy startup and established business choose? Let’s find out!
The scrappy startup is focused on improving customer retention. Since the factors that influence retention vary from client to client, they use a relational NPS survey to see which clients (especially their Fortune 500 accounts) are at risk of churn.
The more established business knows that once clients reach a certain milestone in their level of engagement, they’re more likely to buy more from the business. As a result, the business uses a transactional NPS survey to clients who reach that milestone. The survey helps them see which clients are, in fact, ready to spend more and which aren’t.
03 Survey design
The steps for writing your questions
The process of creating your survey isn’t always straightforward, and it should be a team effort. In this section, we’ll break down how you can work on the survey with colleagues, the types of questions you can ask, and how to ask your questions so that you get honest and thoughtful responses.
Collaborate on your survey during its early stages
Imagine that you’ve finished your survey and feel prepared to send it—only to have colleagues request last-minute edits! This can really throw off your timeline. Before we even get into how to create your survey, it bears mentioning that it’s a good idea to involve your colleagues in its design.
It not only stops them from giving feedback at the final hour, but can also help you improve the quality of your survey and ensure you’re asking all the critical questions.
As a side benefit, your colleagues can spot and fix the small things. Whether it’s related to grammar, the wording of your questions, or missing answer choices, a pair of fresh eyes can be all it takes to fine tune your questionnaire.
When considering who to partner with, keep the following in mind for each team:

Once you’ve decided who to collaborate with, here are some different options for sharing your survey:
- Does your team like to work on Google docs? Craft your questions in a doc and once they’re finished, simply copy and paste them into a new survey.
- Do you feel comfortable with certain colleagues editing your questionnaire? Just put your questions into a survey on SurveyMonkey, and share it with them.
- Hoping to get feedback from certain colleagues but prefer that they don’t edit the survey directly? Invite them to give comments.
- Want certain colleagues to see just a preview of the survey? Share the survey with them but edit the default permission setting, Full Control, to View Only.
Once you know who you’ll work on the survey with and how to collaborate on it, you can begin to brainstorm its format.
The different lengths of NPS surveys to consider
So how long do you want your customer feedback survey to be?
In general, your NPS survey should be relatively short (think 5 questions or shorter). You’ll only want to ask what you really need to know and are prepared to take action on.
Anything that’s non-essential isn’t worth taking up your customers time—or your own when you review the responses.
Furthermore, because your survey is likely to go out multiple times a year (more to come on how to send your survey later in this guide), making it any longer than it needs to be increases the likelihood that customers burn out from taking them in the future.
Here are the different lengths that your relational and transactional NPS surveys can have:
The 2-question (transactional or relational) NPS survey: This survey keeps you ultra focused on the NPS, and it can be used as a relational or as a transactional touchpoint. It just includes your NPS question and a follow-up open-ended question that asks why they chose that rating. Here’s an example of how it can look:
Pros:
- It’s the easiest for the respondent to answer
- It’s the easiest to create
- Its responses are the most straightforward to analyze
Cons:
- It lacks additional questions that can help contextualize respondents’ NPS, and understand the factors that are driving their NPS (though custom variables can help you add information on respondents)
Transactional NPS survey: This type of NPS survey builds on the 2-question version by asking the respondent a few more questions (up to 5 questions in total). These additional questions should be straightforward to answer and should center on the event that triggered the survey to be sent.
Pros:
- Still not time-consuming for the respondent to take
- Relatively easy to write
- Helps you contextualize the NPS and uncover immediate actions to improve the customer experience
Cons:
- With more questions, the survey can have a slightly lower completion rate—though the dip will most likely be minimal
- A few questions may still not be enough to provide you with a comprehensive understanding of the customer experience
Pro tip: Keep your survey focused on your primary goal. If you need additional data, you can get it by sending an additional survey. Alternatively, you can try collecting the data through more personal means, whether it’s interviewing customers directly or receiving feedback from your customer-facing colleagues.
Relational NPS survey: This type of survey also includes a few follow-up questions. However, unlike the transactional NPS survey, these questions include a brand attributes question and a “key drivers question”—a matrix question that’s a bit more complex for respondents but effective in identifying the factors that drive your NPS either up or down. Because of the value key drivers bring to your analysis, the relational NPS survey is the gold standard option for tracking changes in your NPS.
Pros:
- Gives you the most comprehensive understanding of the customer experience
- Allows you to identify and act on more specific factors that can substantially improve the customer experience
Cons:
- Because it’s the most time consuming to answer, it’s likely to have a lower completion rate
- With all the response data it can provide, it’s the most likely to take longer to review for your team—potentially leading to a slower response time for customers
Need help deciding which NPS survey length to use? Let’s find out what our startup and established business would do.
The scrappy startup is keen to understand why customers are dissatisfied (and eventually churning)—so they’re set on using a relational NPS survey to find out. They’re particularly interested in asking a key drivers question and a brand attributes question to understand the root causes of their NPS, but given their limited resources in managing the responses they collect, they refrain from asking additional follow-up questions.
The more established business wants to decide which customers are targets for sales upsells and discover any that should be spending more on a given product/service. Since they have a team that can manage responses to several questions throughout the customer journey, they decide to run a series of transactional NPS surveys at different customer touchpoints to find out. But they’re also interested in tracking customer sentiment about their company and comparing it to their competitors. Since they’ve got more resources available, they can run all three NPS surveys.
Regardless of your NPS survey’s length, always ask the NPS question at the very beginning. Otherwise, your NPS data can be influenced by the format of the survey.
Why? Because your customers might get grumpy when they realize how long your survey is taking them, or an earlier question may jog their memory of a specific experience with your team. In either situation (and in whatever other ones might arise), the respondent might be influenced to answer your NPS question in a certain way.
In case you need more convincing, including it at the beginning will lead to more completed NPS responses than asking it later on, as some respondents may drop out of the survey early.
On one of our long-standing transactional NPS surveys, our Voice of the Customer team realized the NPS question was in the middle. After moving it to the very beginning to be consistent with other surveys, our average score on this survey increased by 10 points!
It’s worth noting that since a slight difference can make one survey incomparable to another, we needed to restart our trend analysis once we reordered the NPS question.
5 survey design tips to keep in mind
As you write your questions, you’ll want to keep them straightforward and unbiased. Otherwise, the integrity and value of your customer feedback gets compromised. Here are 5 tips and tricks to ensure that you can collect the responses you need:
1. Always ask an open-ended question after your NPS question
The NPS question is crucial to evaluating customer satisfaction and engagement, but without direct context that explains the rating, it can easily be misunderstood. To avoid any confusion, ask a neutral, follow-up question that looks something like the following:
“Why did you answer that way?
Or…
“What is the primary reason you answered that way?”
Once the responses come back, you’ll be able to understand how your Promoters, Passives, and Detractors really feel (more to come on this soon).
2. Limit your survey to 10 questions
Even better, ask 5 questions. An NPS survey should be less time consuming than other customer surveys that are sent one time and focus on areas like customer research.
Keeping your NPS survey short and to the point forces your team to prioritize the questions you want to ask most—based on the response data you hope to track and act on over time. And for customers, it allows them to put more thought into answering the questions you include.
Also, consider that customers don’t have to respond. Any feedback they offer is a gift to your team. A short, simple survey honors that gift and allows the lines of communication to remain open in the future.
3. Use a page break between your NPS question and your follow up
That way, you can use skip logic (a feature that determines the question or page a respondent sees next based on how they answer the current question) to personalize your open-ended follow-up question based on their score.
For example, if the respondent is a Promoter, your skip logic can take them to an open-ended question that asks, “Please help us understand why you chose the score above” And if the respondent is a Detractor, your skip logic can take them to the question, “How can we improve the rating you gave us?”
Also, once a respondent goes on to the next page of your survey, their responses from the previous page get saved automatically. This means that if a respondent doesn’t feel like explaining the reasons behind their rating and leaves your survey, you’ll still know their NPS.
Note: Since this tip involves asking different questions to respondents (based on their NPS rating), you’ll need to separate your analysis of the open-ended feedback by Promoters, Passives, and Detractors as opposed to looking at all of the responses together.
4. Don’t use more than one comment box (or free response) question
To clarify, the only one we recommend you include is the one that follows your NPS question. Here are some reasons why:
- Many of your respondents will take your NPS survey on a mobile device—more than 40% of SurveyMonkey users take surveys on mobile!
Typing in answers to free-response questions on mobile is extra time consuming, so it can easily lead to more people leaving your survey or providing shorter responses.
- You want customers to continue taking your NPS surveys. Otherwise, you won’t be able to identify new trends in the customer experience and measure improvements over time.
If each survey is time consuming to respond to, your customers can eventually burn out from taking them all together.
- Analyzing open-ended responses is more time consuming for your team than closed-ended responses (making them more difficult to address promptly).
Pro tip: Make your free-response question (and all of the follow ups to your NPS) optional. This helps you respect your customers’ time, and it also makes them less likely to leave your survey.
5. Ask demographics questions
These include details about the customer’s personal background, their company, and your engagement with them. However, only ask a demographic question if you can’t easily retrieve the data ahead of time and only ask questions that are critical for your organization. If you already have access to the data, you should include it as custom data associated with your contacts in SurveyMonkey. Either of these options let you include demographic information in your survey results and allow you to filter by them to see how specific groups of respondents answered your other questions.
When it comes to best practices in writing surveys, our survey experts have a lot more helpful advice. If you’re still curious, check out these 5 features that can help make your next survey a success.
04 Sending
Where and how often to send your survey
The system you set up for sending your surveys can be one of the trickiest aspects of running a customer feedback program.
You need enough responses to be sure you’re getting a clear signal and that the patterns you’re seeing in your results are actually real. On the other hand, the worst thing you can do is over-survey your customer base. Sending too many surveys can easily lower your response rate—impacting the validity of your results.
In this section, we’ll cover how to walk this fine line by strategically planning:
- How many customers to survey
- How often to share your surveys
- The best methods for sharing your surveys
Determine how many customers to survey
Deciding the precise number of customers to survey and the exact number of times to survey them depends, in part, on the type of NPS survey you’re planning.
Transactional surveys: Since these surveys are triggered by customer actions, you have less control over how many each customer receives.
That means you have to be thoughtful about which customer touchpoints trigger a transactional survey, so you can space them out throughout a customer’s journey. If you notice that your transactional touchpoints lean heavily toward a certain stage in the customer journey, try to replace a few of them with high-value touchpoints at other stages.
Relational surveys: Unlike transactional surveys, the number of customers who receive relational surveys is completely within your control and requires some reflection.
Start by looking at the size of your customer base, since relational surveys repeatedly sample portions of that customer base over time.
You want to make sure you get enough responses that you can trust your results, while at the same time ensuring you don’t send a customer your relational survey more than once per quarter. That means you have to calculate the number of responses it would take for your results to be statistically significant (or at least meaningful enough to draw conclusions from) with the confidence level and margin of error you want. In other words, you need to find your ideal sample size.
Note: Margin of error represents the range that your population’s responses may diverge from your sample’s, while confidence level is the likelihood that your sample accurately reflects the opinions of your population.
To review “margin of error” and “statistical significance” further, and to quickly calculate your sample size, check out our sample size calculator or margin of error calculator.
Once you’ve landed on a sample size that matches your priorities, you can decide how often you’ll send your surveys. We recommend sending your relational survey no more than once a quarter, per customer, to prevent overwhelming them.
Let’s imagine two different scenarios for your organization and see how you’d approach surveying customers in each:
Scenario A:
- You have 25,000 customers
- You want a margin of error of 5% and a confidence level of 95%
Using the numbers above, your minimum sample size is 379 customers (we used the sample size calculator to arrive at this number).
Let’s say your response rates from previous surveys are around 20%. This mean you’ll need to email at least 1,895 customers (379 x 5=1,895) to get the sample size you need.
Since you’ve got a relatively large customer base, you’ll be able to run your relational NPS survey many times throughout the year without surveying any one customer more than once per quarter.
Scenario B:
- You have 1,000 customers
- You want a margin of error of 5% and a confidence level of 95%
Using the numbers above, your minimum sample size is 278 customers.
Like before, let’s say that your response rates from previous surveys are roughly 20%. So you’ll need to email at least 1,390 customers (278 x 5 = 1,390) to get the sample size you need.
Since 1,390 is greater than the size of your customer base, you’ll need to raise your margin of error to land on a more realistic sample size. It also means that you’ll have to send your relational NPS survey fewer times over the course of the year, perhaps only 2 or 3 times per year.
In short:

The takeaway from these scenarios is that, all else equal:
The more customers you have to survey, the more times you can send your relational NPS survey without reaching each customer more than once per quarter.
Here’s how SurveyMonkey’s Voice of the Customer team runs their relational NPS survey:
Since SurveyMonkey works with hundreds of thousands of customers, our relational NPS survey goes out monthly to a small fraction of those who have been active on SurveyMonkey over the past 365 days. This lets us evenly space out when each customer receives the survey (no more than once per quarter), and gives our team a steady and manageable level of feedback to address.
Competitive NPS: For competitive NPS, you’ll use a survey panel (a collection of pre-screened individuals who are willing to provide feedback through a survey) to anonymously reach individuals who fit your target audience criteria. Surveying your target market as yourself can bias your responses, as would surveying your personal contacts or customers who are likely to be more familiar with you than with your competitors.
It is ideal to collect responses from 1,000+ individuals. That way, you can segment your respondents based on demographics and still have a statistically significant sample size. And as respondents likely won’t be familiar with each brand you include, surveying more individuals lets you reach a statistically significant sample size for each brand.
If responses from 1,000+ individuals ends up being too expensive for you, start with at least 400 respondents.
Note: If you or a competitor are new to the industry, you’ll need to take the results with a grain of salt, as your respondents may have nothing to base their opinion on. Consider running a brand awareness survey on yourself or on competitors using SurveyMonkey Audience instead. It can give you a more accurate sense of how popular you or your rivals are, and with our customizable template, you can create your survey quickly.
Decide how often to run your survey
As we mentioned before, it’s a tricky balance between surveying too often and too infrequently, but getting the balance right makes a world of difference.
To help you land on the right number of times to send your survey, see the guidelines in the chart below.
| NPS survey type | Survey frequency |
| Relational NPS | Ideal to survey from a group of customers weekly or monthly, but every 3-6 months can be sufficient. |
| Transactional NPS | Send your survey either right after the triggered activity or following a predetermined delay in time. |
| Competitive NPS | Best to survey every 3-6 months to account for seasonality and changes in the industry, but 1-2 times per year may be enough. |
Pick the best channels for sending your survey
Deciding how you send your survey depends on the type of NPS survey you’re running:
Relational NPS survey: Send the survey using our email collector or include a link to it in an email you send on your existing email platform (e.g. Responsys or Mailchimp).
Sending your survey on another channel (e.g. embedding a survey on your site) can bias your responses based on the customer’s experience on that channel.
If you use our email collector, keep the following tips in mind:
- Schedule the delivery of your survey in advance. This prevents you from forgetting to send it on time, and lets you send your survey to a large number of customers, easily.
- Embed your NPS question into your email. By embedding it, you’re allowing respondents to answer the question directly on the email, which then triggers your survey to open in a new tab.
Transactional NPS survey: When possible, send it on the channel the customer interacts with you on. Otherwise, send it via email. Here are some common triggers:
- Customers finish reading support-related content: You can embed or link to a short questionnaire at the end of that piece of content.
- Customers run into issues with your product online: You can trigger an in-app pop-up that asks the respondent for feedback. Our mobile SDK can help you do this using predefined rules that determine when your survey appears.
- Customers finish speaking to someone on your team: You can send them a survey via email.
- Customers complete one of your training sessions: Email attendees after your session, or share a QR code (either on a screen or printed out) at the end so they can take your survey by scanning it with their phone.
Take your customer feedback program to the next level by integrating SurveyMonkey with your customer relationship management (CRM) tool. The integration lets you automatically: send your transactional or relational NPS survey, put the responses back into your CRM, and notify the appropriate colleagues of the responses immediately.
Competitive NPS survey: Survey your target market using a survey panel.
Here’s where SurveyMonkey Audience can help. It allows you to specify your audience (e.g. job title, location, age, etc.) and define the number of people you want to reach out to. It then collects survey responses for you in just a matter of days.
05 Analysis
Finding and showcasing engaging data
With all of the great customer feedback you’ve collected, it’s time to make sense of it.
No matter which type of customer feedback survey you run, the first thing you’re going to want to do is check your NPS.
Your NPS is your highest-level indicator of whether things are going well, or poorly. It’s also the starting point for what you do with your results next.
See something alarming that requires immediate action? You can address it right away. Want to start digging deeper into your results? Your NPS will provide the first clue on where to start.
Once the responses start coming in, your NPS should be the first thing you see when you click the Analyze Results tab of your survey.
After viewing your overall NPS, check out the number of Promoters, Passives, and Detractors you have. This breakdown drives your score and helps you understand the distribution of customers who are loyal, content (but unenthusiastic), and at risk of churn.
Pro tip: NPS is just a number, and it’s not always clear if your score is good or bad. If you used the NPS question from our Question Bank, you can access our Benchmarks feature to compare your score to other companies like you. To access it, click on “Show Benchmark,” above the question prompt.
1. Address red flags immediately
Once you’ve seen your NPS and the breakdown of Passives, Neutrals, and Detractors, you should have a pretty good idea of whether anything is amiss in your results. Not every minor change in your NPS warrants immediate action, but here are a few things that do:
- A sudden, sharp drop in your NPS
- A significant increase in the number of detractors (not always evident from your overall NPS)
- Alarming competitive survey results
Alternatively, you can take a more granular, systematic approach by basing your red-flag strategy on the individual responses. This means defining the range of scores that require an immediate response, and who should address them.
For example, one global demand generation company escalates every score that’s below a 5 to their VP of client success, while a 5 or 6 rating is immediately shared with the client success manager.
Whichever emergency plan you decide on, skip immediately to chapter 6 of this guide when you’re ready to take action.
2. Analyze your open-ended responses
You can think of the open-ended responses you put after your NPS question as an opportunity to spot what’s driving your NPS up or down. One convenient way to look at these responses is to use a word cloud in the Text Analysis feature. This feature picks up on the key words or phrases that appear most often in the responses, and shows how often they each appear by their relative size.
Word clouds are mainly useful for presenting your results, but they can also give you ideas for where to focus your analysis.

The words and phrases from your word cloud can carry different meaning, depending on the type of NPS survey you ran:
- Relational NPS survey: The words and phrases are likely deeply rooted in the customer experience and will take a fair amount of time and resources to address.
- Transactional NPS survey: The words and phrases are more targeted, just like the touchpoint that elicited the responses. In general, you’ll be able to address and improve these areas faster than you would from those in the relational NPS survey.
- Competitive NPS survey: You’ll uncover the top competitive advantages and disadvantages for your business.
3. Dig into your follow-up question
Assuming you didn’t use the 2-question NPS survey, you’ll want to see how customers answered your additional closed-ended questions (questions that include answer choices, like multiple choice questions). The answers to these questions can help explain why customers answered the NPS question the way they did, so it’s critical to match them up with your Net Promoter Scores to see if they’re related.
Charts can help you visualize the results. They summarize the data in an easily digestible way and help you pick up on key patterns more quickly.
Say you use a multi-select question to ask respondents what they like about using your product. A bar chart, like the following, could help you make subtle comparisons across your answer choices:

Though close, you can see that value beats out the other options as your top differentiator.
Now say that you want to know the top thing that customers like about your product. You can use a pie chart! This type of chart works great in accentuating the differences in popularity among choices:

This time around, it’s clear that value beats out the other options.
There’s nuance in creating different kinds of charts. For example, a line/area graph can be created from any closed-ended question, while pie/donut charts can only be used from a closed-ended question that requires a single answer. To learn more about each type of chart, check out this blog post.
4. Home in on patterns using filters
A filter is a survey analysis tool that lets you focus on particular subsets of your data to see how specific groups respond to your questions.

For example, you could filter by your Promoters. Once you look at their responses to your other survey questions, you might find something unique about their experience that can help you improve it for Passives and Detractors.
It’s generally a good idea to try out multiple different filters so you can see various cuts of how people answer.
Here are some ideas:
- Filter by a demographic question (if included) to see how different groups responded (e.g. length of time being a customer, company they work for, job title, etc.).
- Like our example, filter by your NPS question to see how Detractors, Passives, and Promoters answered the rest of your questions and what motivated them to answer the way that they did.
Pro tip: To effectively filter your open-ended responses, begin by creating tags that are critical to your product and/or your business. Then tag each open-ended response as appropriate. Afterwards, you’ll be able to filter by your custom tags to more easily find the responses you’re looking for, and to identify the key themes in your feedback faster.
Keep in mind that filtering by your NPS and demographics benefits your relational, transactional, and competitive NPS surveys in slightly different ways:
- For relational surveys, it allows you to learn how happy or unhappy different groups of customers generally are and why.
- With transactional surveys, you can find out why specific groups of customers are happy or unhappy from a specific event in the engagement.
- For a competitive NPS survey, applying filters presents a chance to discover the factors that give you a competitive edge and the areas that hurt your ability to challenge rivals—across different groups within your target market.
5. Use Compare Rules to spot similarities and differences among customers
Compare Rules allow you to evaluate one group of customers against another (or several others), side-by-side. Like filters, you’ll want to check off different demographics—depending on the segments you want to compare.
Say you want to see how customers who have worked with you for different periods of time might have answered your questions differently.
If you check off the answer options, “More than a year” and “Less than a year,” and then compare the two groups with the question, “How would you rate the quality of the product?” the chart can look as follows:

The bars on the left side represent customers who’ve worked with you for more than a year, while the bars on the right belong to customers who’ve worked with you for less than a year. The colors of each bar are associated with a specific answer choice.
In this example, it appears that customers who have been around for more than a year have a slightly more favorable impression of your product’s quality.
Note: You can’t use Compare Rules on your NPS question.
Still curious about our Compare feature? Learn more by reading our help center article.
Finally, wondering how our startup and established business would use filters and Compare Rules?
Remember that the scrappy startup is determined to improve customer retention, particularly among their Fortune 500 accounts. This leads them to filter by their Fortune 500 accounts first. They take a look at the NPS, the individual responses, and see how the respondents at these accounts answer the key drivers and the brand attributes question. Then, to better understand how the Fortune 500 accounts’ experiences differ from smaller clients, they compare clients by company size, and see how each group answers the key drivers and the brand attributes question.
At the same time, the established business’ focus on upselling and cross-selling motivates them to filter by Promoters first. They pay especially close attention to responses that explicitly request buying another product/service and/or adopting a more advanced version of what they already use. Their secondary focus is on Promoters who’ve generally experienced a lot of value (and are therefore strong candidates to sell more to).
6. Track your results over time using Data Trends
Data Trends let you see how the answers to your NPS question and other closed-ended questions in your survey change over days, weeks, and months.
Trends in your NPS help you determine whether your customer experience is improving, keeping consistent, or worsening over time; while the trends in your closed-ended follow ups help you understand why your NPS is changing the way that it is.
Your data trends may lead to different types of insights and action items, depending on the type of NPS survey you use:
Relational NPS survey:
| Types of findings | Types of conclusions |
| -How value that product delivers evolves over time -Changes in quality of customer support | -Whether product needs improvement and where to improve it -Changes in quality of customer support |
Transactional NPS survey:
| Types of findings | Types of conclusions |
| -How specific elements of product are performing over time -The way support quality is evolving over individual points of interaction | The particular parts of product and service that already perform well and the parts that need to improve (as well as how to improve them) |
Competitive NPS survey:
| Types of findings | Types of conclusions |
| If you’re losing or gaining a competitive edge | What’s helping and/or hurting you in being competitive and how to best address it |
Want to access and use Data Trends? Learn how.
06 Action
Putting your data to use
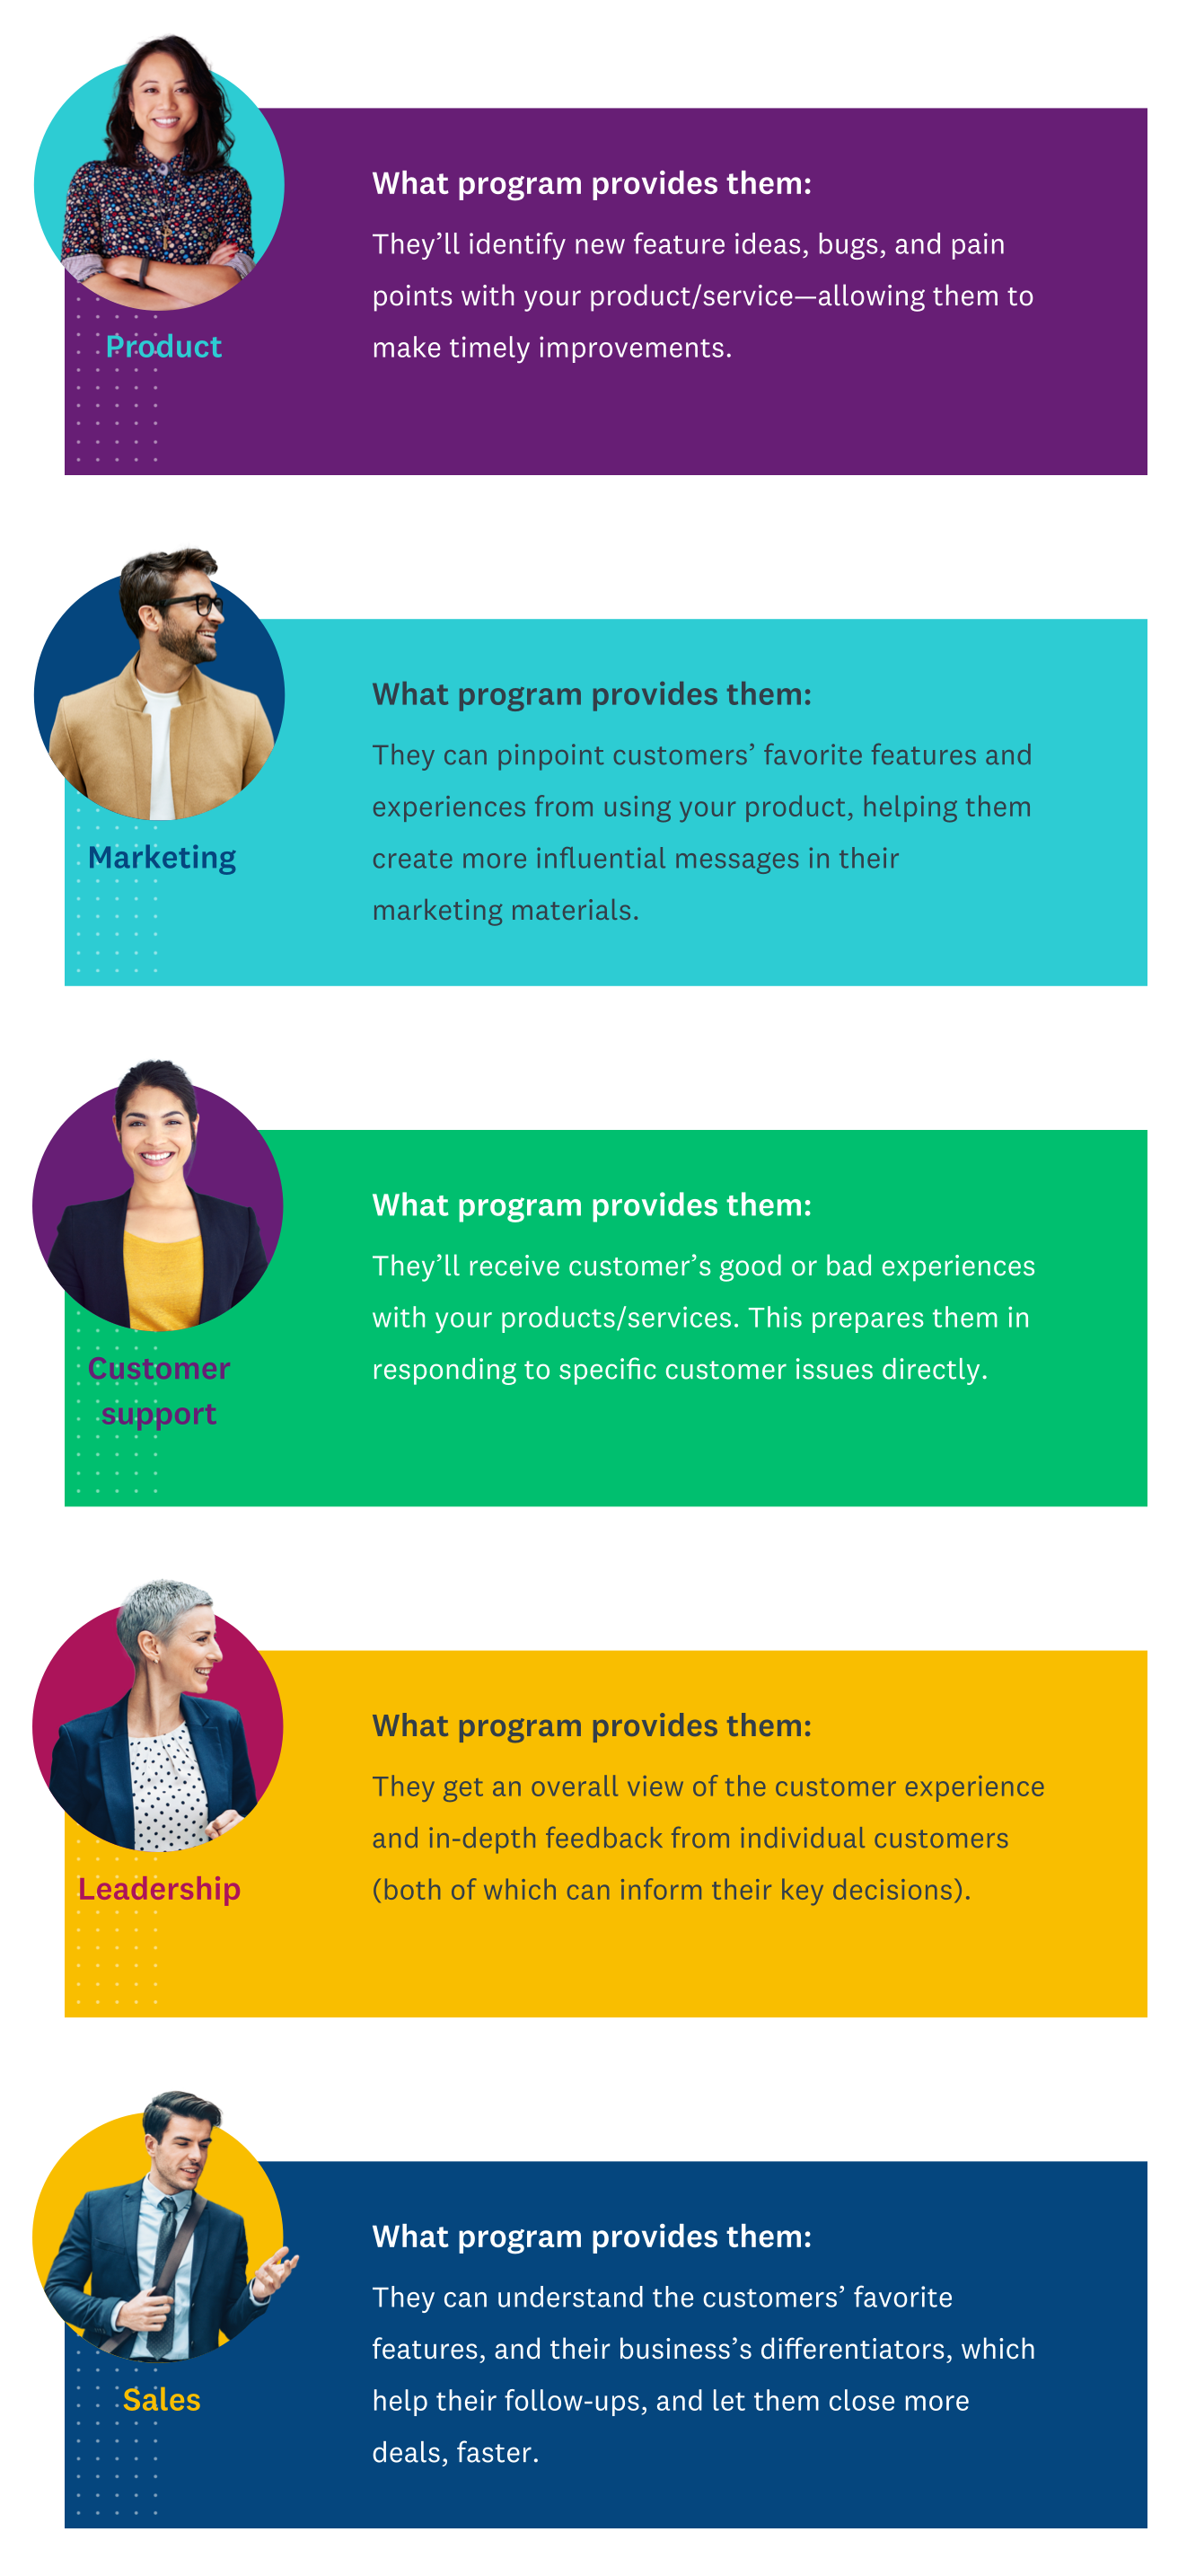
No matter how thoroughly you analyze your survey results, they won’t drive any value for your organization if they aren’t shared with the teams who can act on them. Which teams care about which types of survey data? This chart will give you an idea.

Don’t worry if this looks overwhelming right now. It’s up to you to prioritize who gets customer feedback, when they get it, and how.
Your options for sharing the data with each team
You don’t need an advanced system for sharing customer feedback in order to be successful. Here are 7 common ways to share your results with different types of colleagues:
- Some colleagues just need to dive into the complete data. If you want them to be able to analyze the responses however they see fit, just share the entire survey with them.
- Other colleagues don’t have the time to dig through the data. Use filters and Compare Rules to show them only the information they care about. Once you’ve got a view you like, edit the sharing permissions to “View Only,” and then share the survey results directly with them.
- Planning to use your results in presentations or handouts? You can export any chart from your data as a PDF or as a PowerPoint to easily use in meetings.
- Colleagues who are really data-savvy might want to engage in deeper statistical analysis with your results. Try exporting your responses and sharing it with them as an SPSS file or a CSV file. They can then open the results in the programs they already use.
- Practically anyone can benefit from you presenting your data in an intuitive, easy-to-read Results Dashboard.
- If you’ve integrated SurveyMonkey with a CRM like Salesforce, it can automatically send relevant colleagues a notification when a customer responds.
- Integrate with Zapier so you can share the responses on a platform your colleagues already use.
Now that you know the options for how to share your survey data, you’ll need to make sure that your different teams receive the response data quickly.
Customer-facing employees are one of the teams you’ll almost certainly share the responses with. After all, they’re the ones who can make the best sense of the responses for each customer and respond to them directly.
Choosing the best way to share your customer feedback with these employees depends a lot on the size of their team. Here’s how the customer-facing employees at our scrappy startup and established business access the feedback:
At the startup, only one person interacts with customers regularly. For them, it may be easiest to simply give them full access to the responses on SurveyMonkey.
Meanwhile, the established business has customer success managers (CSMs) who manage the customer relationships. To filter the customers’ responses by each CSM, they add a column to their contact list CSV file (before uploading it into SurveyMonkey) that includes the relevant CSM for each customer.
Once the responses return, the feedback is shared with each CSM in the following way:
1. They filter by a CSM, and save the view.
2. They share a password-restricted view of the responses with the CSM.
Now each CSM knows how their customers responded to every question, and can address the feedback appropriately.
Several other teams may also need to see the responses quickly, but before you decide what to share with each of them, consider what they’re looking for.
| Sales | Marketing |
| They’ll want a list of Promoters and their responses, organized by industry, location, among other demographics. They’ll use the responses to identify leads for cross-sell and upsell opportunities. | They’re looking for a list of Promoters and well-known clients who could participate in marketing activities and whose responses they could use in promotional materials. |
| Product | Leadership |
| They’re interested in getting a representative sample of responses from Detractors, Passives, and Promoters, so that they can understand what’s going well and what could be improved. They’re also eager to see the results from competitive NPS studies and understand how the NPS is trending over time. | They want to receive presentations that explain the changes in the NPS over time. In addition, they’ll want to know your plans for responding to the recent customer feedback, get updated on new learnings about your customers, and see the competitive NPS. |
Deciding who you respond to
Replying to survey responses in a thoughtful way is often a huge untapped opportunity. As SurveyMonkey’s leader for our Voice of the Customer team, Brooke Landon, explains:
It might be appropriate to personally respond to every customer if you’re a B2B company with a very small, strategic customer base, or if you’re a small new company that wants to learn from every single customer interaction.
But for the rest of us, you have to be selective with who you choose to personally respond to, based on how closely the customer and their feedback match your program’s goals.
Pro tip: Let every customer know how much you value their feedback in your survey’s end page (the page they see after submitting the survey). You can use the page to detail how you manage their responses and provide examples of what you’ve done with customer feedback in the past.
In some cases, the main goal of your response is to spur a conversation with your client. This is exactly what the SurveyMonkey Enterprise team’s feedback survey aims to accomplish:
The survey is sent weekly to a rotating group of customers, and every customer success manager replies to each of their clients who have completed the survey. It often leads to a call, which, over time, has revealed important insights that can lead to a customer testimonial or even to saving a relationship they didn’t realize was in trouble—well in advance of renewal.
How you decide to respond to clients can change based on your goals, customer base, and business size. Here’s how our fictional companies respond to their customers:
With the startup focused on retention (particularly with their biggest accounts), and limited in resources, they prioritize responding to Detractors who work at one of their Fortune 500 accounts.
Since the established business hopes to lift sales from existing customers, the customer success team prioritizes responding to Promoters—particularly those who explicitly express interest in trying another one of the businesses’ offerings or mention a challenge that matches with something else the business can offer.
Share the responses with the wider team
Building a customer-centric company starts with ensuring that your employees are hearing from your customers. And what better way to connect the wider team with customers than by consistently sharing your survey responses with them? This can help employees understand how their work helps customers, which may keep them more engaged. And it can inspire employees to search for new ways to deliver clients more value.
Here are two options to consider for sharing your responses with their respective advantages and disadvantages:
1. Send a recurring email to your team that highlights the results
Advantages
- Simple to send
- Easy for employees to check
- Less time consuming to manage as you’ll include relatively less information
Disadvantages
- Can potentially bother employees who don’t want to receive the emails
- May exclude important information for the sake of email readability
2. Share the results on a platform employees use regularly (e.g. CRM, messaging platform like Slack, etc.)
Advantages
- Can include a comprehensive amount of information, keeping employees more informed
- Likely easy to integrate survey results to these channels
Disadvantages
- Employees can easily miss or skip over the information
- Including too much information can overwhelm employees
- More time consuming to maintain as you include more information
Our Voice of the Customer team puts the results from all of the NPS surveys into SurveyMonkey’s internal information hub, Treehouse. On each NPS survey page, you can find sections that summarize what that NPS measures, why it matters, and who in the organization manages it.
For each NPS survey page, our team also…
- Updates the results quarterly
- Uses a graph that shows the score’s trends over time
- Includes a written description that summarizes the results and actions various teams across the organization commit to
You’re left with one final step in building your customer feedback program: assessing its performance. Let’s break it down.
Evaluate the program’s success
To ensure your program is effective over time, you’ll need to consistently reevaluate it.
Begin by checking its performance against the goal you set at the very beginning. Then review why you were (or weren’t) able to meet your goal. What were the top roadblocks to running the program effectively, and what’s helped the program perform well?
As you review your program, see if you can tie its performance to any type of financial success. It can be as simple as correlating an X% lift in revenue with an improvement of Y points in your NPS, on average. The more value you can associate with the program, the more support you’ll get from your leadership team.
Then, ask yourself if the responses you shared with colleagues led them to take action. If it did, what kind of impact did these actions deliver? And if it didn’t, what stopped them from using the feedback?
Ask colleagues directly to find out how your program performed. A survey works great in that it can guide colleagues into giving the type of feedback you’re looking for while giving them time to reflect on their responses. Plus, you can use the opportunity to gauge how close they feel to your customers—something our customer centricity survey template can help you measure.
But before you ask colleagues for feedback, review the long-term benefits that different teams get by acting on the customers’ responses. You’ll be better positioned when you ask for their input.

Once you’ve reflected on your program, you’ll know how to improve it going forward. Plus, you’ll be able to give a more thoughtful and insightful explanation of the program’s value to leadership (and to anyone else) when they ask about it.
And with that, you’ve built a complete customer feedback program! By following the best practices throughout this guide, you’ll be positioned to deliver a consistently improving customer experience, and receive tangible financial returns for your organization in the years to come.
The old saying, “The customer is king” may be true, but great customer feedback lets both of you share the throne.
Get started on your customer feedback survey today
Design your survey
Create your own survey or use one of our survey templates. You’ll be off and running in no time.
Find your audience
Reach consumers in over 130 countries with SurveyMonkey Audience to get real-time feedback on your ideas.
Discover more resources

Customer satisfaction survey templates
Explore our customer satisfaction survey templates to rapidly collect data, identify pain points, and improve your customer experience.

Beyond CX: How SurveyMonkey + Salesforce turn feedback into revenue
SurveyMonkey + Salesforce turn feedback into revenue

Get the feedback you can act on with online evaluation forms
Unlock the power of feedback with SurveyMonkey's online evaluation forms. Start with our form builder today!

The complete guide to user experience metrics
Learn how to measure attitudinal and behavioral user experience (UX), and how UX supports better CX.
Create your own customer feedback survey
Sign up free