Set goals! Make improvements! Grow! You may hear these words floating around your organization. But when it comes to building a better business, it’s tough to figure out where you need to go–and how to get there–if you don’t have a good sense of where you’ve been.
If you do want to track your organization’s progress, it’s a super smart idea to set business benchmarks to measure how your business performs throughout the year. Whether you’re evaluating customer satisfaction, employee engagement, or anything else that doesn’t come with a handy metric, using surveys can be a great way to do it.
What is benchmarking?
Like many people, you may watch your weight. And sometimes, you may feel compelled to lose weight based on how tight your jeans are or whether or not you feel fit. But it’s possible that your need to lose weight really hits home when you step on the scale:
“I’m 10 more pounds than last year?!”
Your old weight is a benchmark, and any measurement that deviates from that benchmark, good or bad, helps you measure your progress and set a goal.
So, define benchmarks.
In order to set a goal in the first place, you need to know where you stand. That’s the benefit of benchmarking.
We define benchmarking as: the process of setting a baseline or standard for your organization–so you can measure your performance over time, find areas for improvement, and set goals.
SurveyMonkey Benchmarks is a simple way to compare your survey results with thousands of other organizations.
Who uses benchmarks?
Businesses of all shapes and sizes use benchmarks to measure business metrics that are hard to quantify: customer satisfaction, employee engagement, and brand awareness, just to name a few.
To give you a sense of what defining benchmarks can mean for your business, we surveyed over 300 business owners with SurveyMonkey Audience to see how they use customer satisfaction surveys and benchmarks.
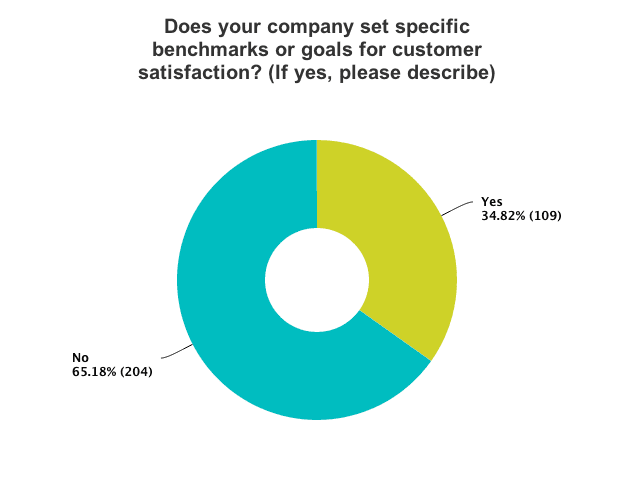
Only 35% of the business owners we surveyed said they set benchmarks or goals. We also asked these businesses how successful they consider themselves. When we filtered the results, it turned out that over 90% of businesses that consider themselves successful use benchmarks. Of businesses that don’t set benchmarks, just 71% consider themselves successful.
The benefits of benchmarking–an example:
With sales and revenue goals, it’s obvious whether or not you hit the numbers. But let’s say your company wants to measure your Net Promoter® score (NPS) to understand customer customer satisfaction and loyalty, and you want to know how likely it is your customers will recommend you to someone else (which is a great way to gauge brand loyalty, by the way).
But what does it mean when you get the results and see you’ve received a score of 32? At first, that figure may be disheartening–people aren’t particularly likely to recommend your company to others. Or maybe it’s good? It’s hard to say without a little context.
When you set benchmarks and track data trends, that 32 can start to mean a lot. Say you get your NPS up to 36 next month and 52 this time next year. Bam! You’re doing something right and you have results to feel proud about–or even show off.
Who else uses benchmarks?
Whether you’re a school administrator tracking students’ engagement, or a human resources professional measuring employee satisfaction, you can use surveys to quantify abstract concepts and turn them into benchmarks.
And whoever you are, or whatever you do, we’ve got expert-certified survey templates that can make it easy to define benchmarks. Here are some places to get started:
If you’ve already run one of these surveys then you’re halfway there. Even if you’re not making a conscious effort to set business benchmarks, you can benefit from surveys you’ve already created. Just repeat an old survey to see where you stand!